A few weeks ago we mentioned the impact that refracs could potentially have in the Haynesville. (See – Can Refracs Bring New Life to the Haynesville?) We’ve spent some time digging through Haynesville production history, and we’re finally ready to analyze and discuss the results that appear in the state level data as well as discuss how the economics of Haynesville refracs compare to the economics from new wells in that play.
The chart below shows five wells that BTU Analytics has identified as being refrac’ed. Two wells are operated by BHP Billiton, two by Shell/Vine Oil & Gas and one Encana well.
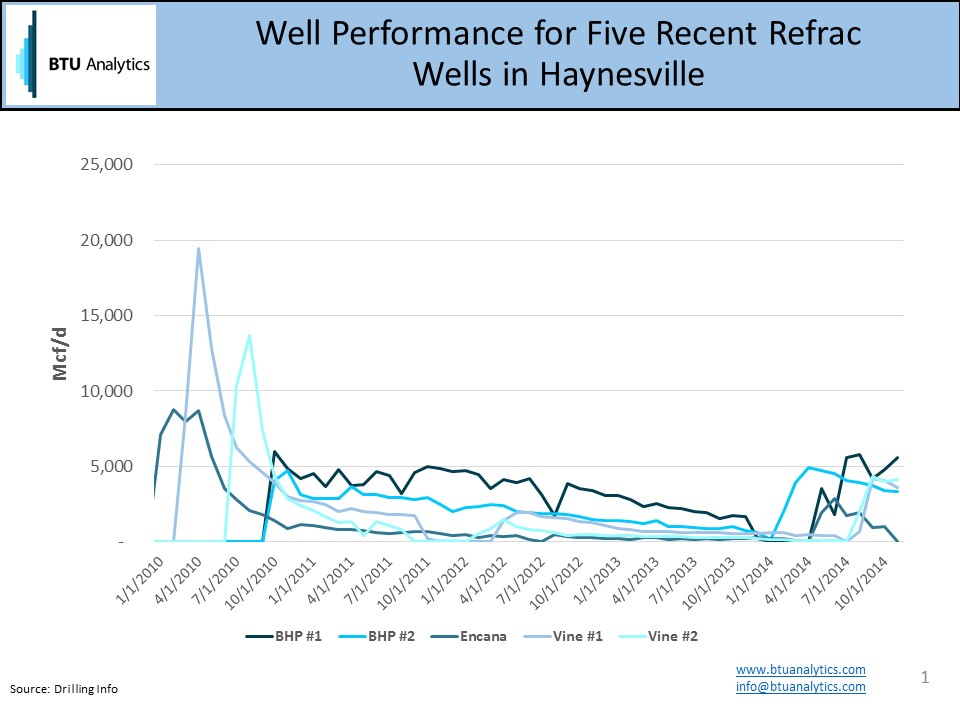
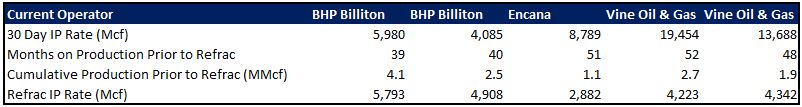
These five wells all demonstrated peak monthly natural gas production in 2010 and had been declining from those levels prior to refracing. The table below shows IP rates, months on production and cumulative production prior to refracing. All of these wells appear to have been refraced in 2014, with daily production rates climbing back up to 3-5 MMcf/d.
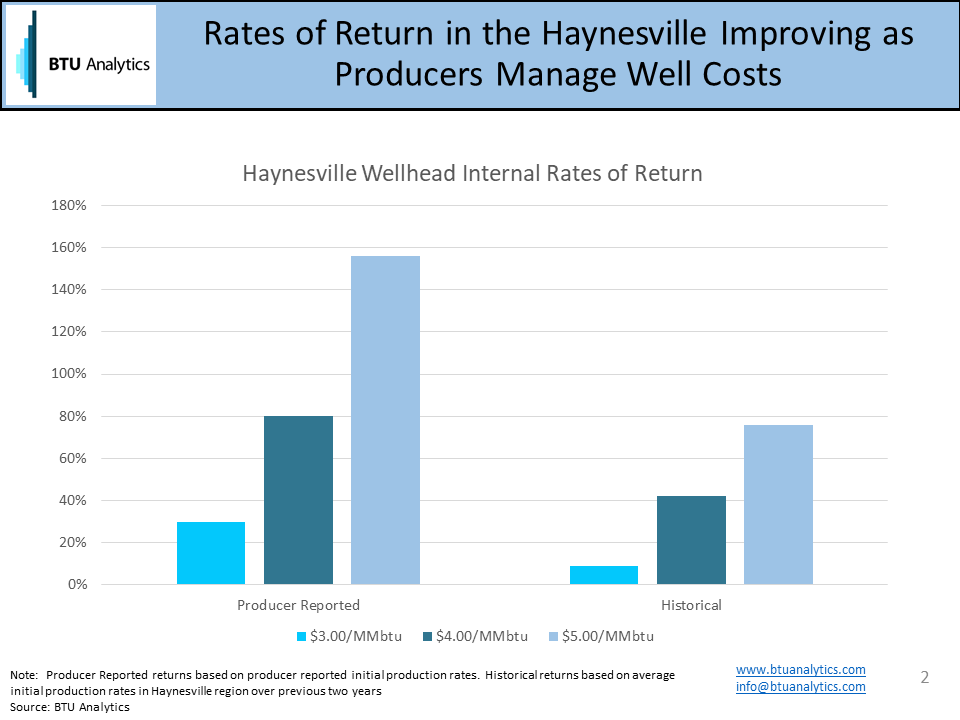
More production from existing wells is great, but for refracs to significantly impact the Haynesville market, the economics of refracing will need to compete with the economics of drilling new wells. The chart below shows our most current run of well economics in the Haynesville based on both producer reported initial production rates and declines as well as the initial production rates and declines BTU Analytics calculated from state data utilizing data from 2013 and 2014.
To compare the economics of refracing to these numbers, some major assumptions will need to be made at this point. First, we only have a few months of production following the refracs, hardly enough to establish credible decline profiles. Based on the well performance witnessed to date and our fingers in the air, we have assumed that these wells decline as they would following their initial completion, i.e. at 65% in the first year, although the small sample results do indicate shallower decline rates.
The other major assumption is the cost of these refracs. Encana has stated that the refracs they are testing are in the $1.0-$2.0 million range. The chart below shows our estimated economics of the refracs, based on the examples we found in the data and the assumptions listed above.
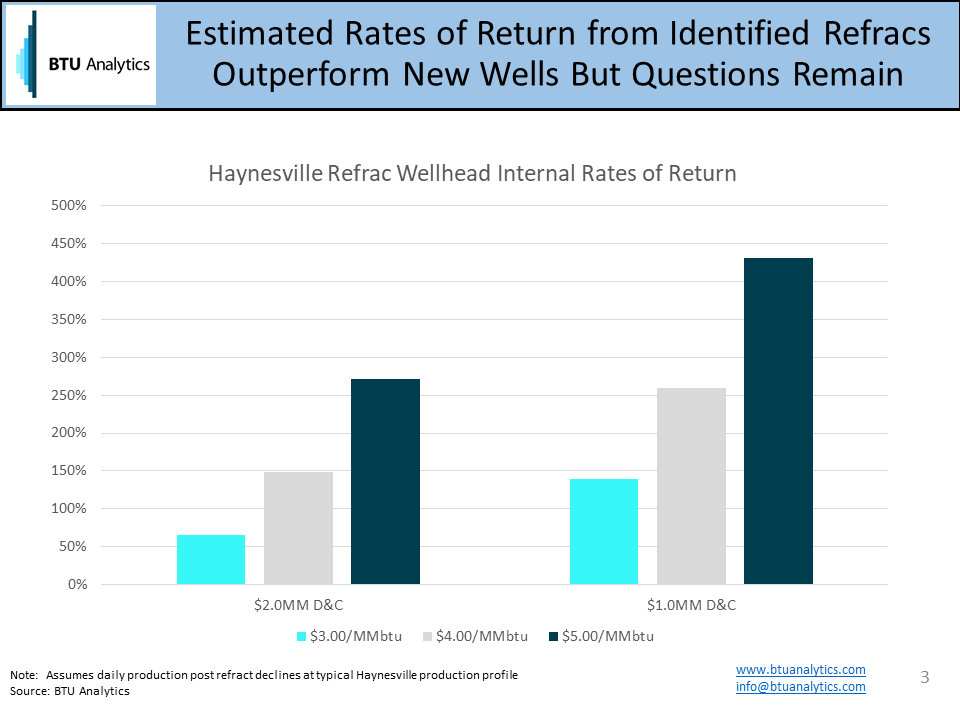
These returns look great, so what’s keeping producers from moving to refrac wells in significantly greater numbers? Our analysis above was based on results from wells that we identified as refracs by looking at the production pattern. We likely missed a number of wells where the refracs were not as successful (or obvious to the naked eye). If we were to identify those wells and average in those results, the average outcome is likely to be less spectacular, but only time will tell.