An additional 3.5 Bcf/d of new takeaway capacity is due to come online in Southwest Appalachia by January 2018. Now that Phase 1A of Rover is operational, many in the market are fixated on whether or not new capacity will fill immediately with new production. The number of wells that can be turned to sales to fill new takeaway capacity is an important variable in how quickly production can grow once this new pipeline capacity is in service, as is the productivity of new wells. BTU Analytics’ August edition of the Northeast Outlook discussed the impact of well productivity on the time it will take to fill new pipe. And today, a new five page supplement to the Northeast Outlook is going out to clients with a deep dive on backlog in Southwest Appalachia. Here are a few graphics from the piece:
BTU Analytics expects a gradual increase in new regional production over the next 12 months, driven by drilling activity rather than a pop of new production that quickly fills all regional takeaway, as was witnessed with new capacity additions that came in-service prior to 2016. Monitoring recent trends with the startup of Rover has supported this: Rover is flowing about 700 MMcf/d, despite regional production receipts only increasing by about 200 MMcf/d. However, to understand the sensitivity and risks around the number of wells that realistically can be turned sales in this timeframe and thus how quickly production may grow, a detailed rundown of regional backlog is an important exercise.
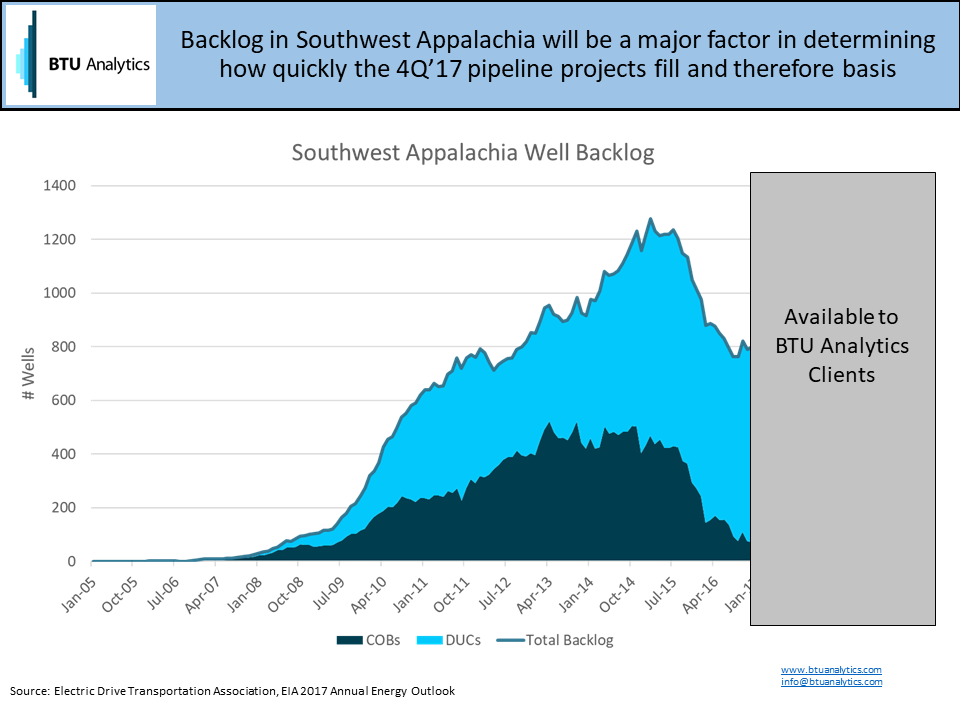
The chart above shows Southwest Appalachia well backlog through time. The backlog grew to over 1,200 wells in early 2015 before declining dramatically through 2016 as drilling activity in the Northeast fell but Appalachian production continued to grow. Note that BTU Analytics breaks backlog down into DUCs, which need to be completed before production can be accessed, and COBs (completed on backlog) which are wells that have been completed but are not yet producing.
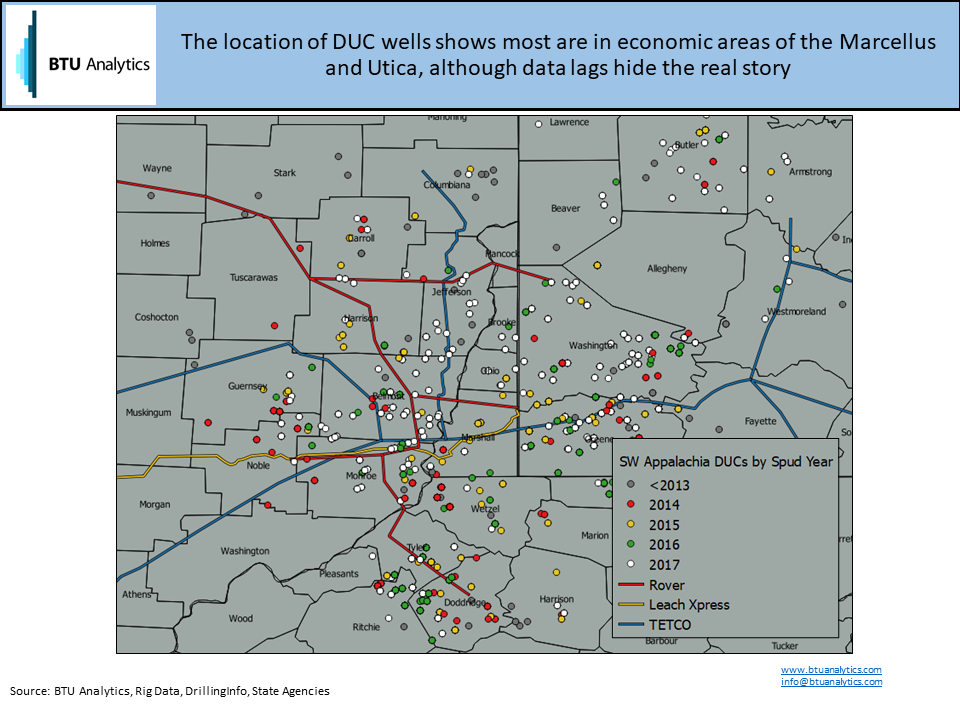
But accounting for backlog isn’t enough in our opinion, understanding the location, vintage and operator of backlog wells is an important step in understanding how ‘real’ this backlog is. The chart below summarizes location and vintage of the original data set from which we’ve researched and removed wells from backlog which BTU does not believe will be turned to sales in the future.
Learn more about BTU Analytics’ products, tools, and services by requesting more information here.