


There has been a lot written about the sustainability of the shale gas model. Dozens, if not hundreds, of folks attack the industry due to “high well costs” and sharp declines. As we pointed out earlier this week, though initial declines are steep, shale well declines turn into long tails. We’ll address the “high well cost” issue in another post to come later, but today we wanted to delve into what do long tails mean to producer cash flow. Do those steep declines prevent operators from ever getting ahead of the curve or are they doomed to face ever escalating capital expenditure requirements that will “pop” the bubble that is shale?
To analyze this issue, I decided to stick with the Fayetteville shale where operations have been highly concentrated since inception among 3 producers: Southwestern Energy (NYSE: SWN), Exxon Mobil (NYSE: XOM), and BHP Billiton Petroleum (NYSE: BHP). Southwestern Energy was the pioneer of the play while BHP acquired its interest from Chesapeake Energy (NYSE: CHK) and XOM acquired its share from Petrohawk, who later sold its remaining shale interests in the Haynesville and Eagle Ford to BHP. We then developed a simple model to estimate cash flow and capital expenditures for the play.
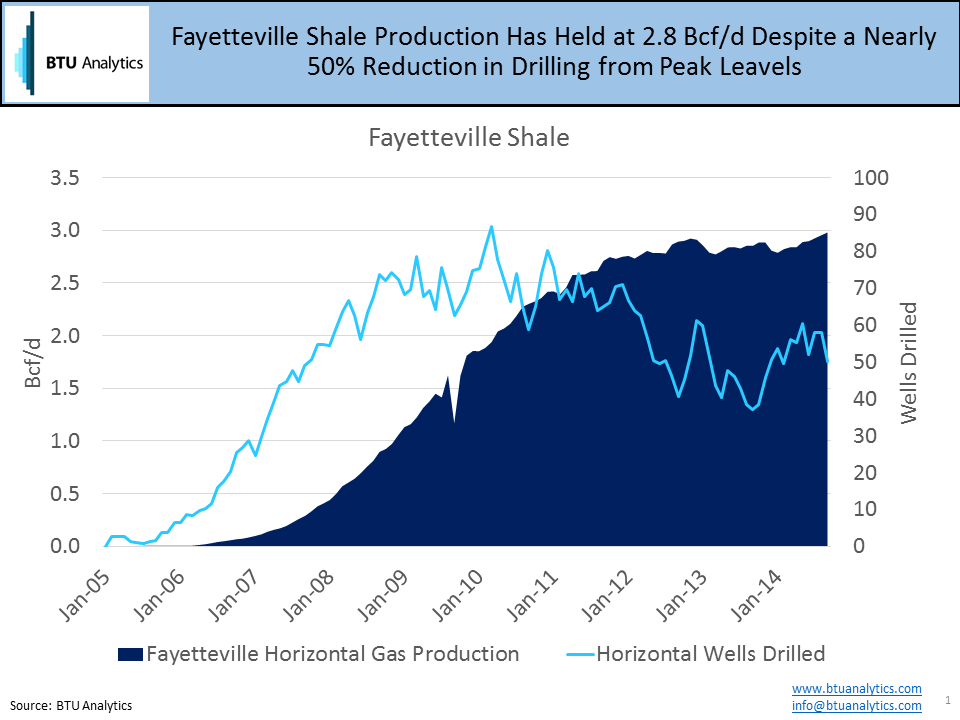
Production in the Fayetteville shale began back in 2005 with the first horizontal wells being turned to sales in May of that year. Since then operators have drilled over 5,000 wells in the play, taking production from zero to almost 3.0 Bcf/d as of September.
Southwestern Energy, the largest and most active producer in the play, has provided well cost data by year since 2005 indicating that well costs in 2005 were $2.0M, peaking in 2008 at $3.3M and have fallen to $2.5M in 2014. In order to be a bit conservative and to account for leakage into other investments (acreage, gathering, facilities, etc…) we grossed those well costs up by 10% and multiplied the grossed up well costs by the number of wells drilled to get total annual capital expenditures.
We then needed to analyze cash flow from the play. We decided to take a few conservative short cuts to conduct this analysis. First we assumed that producer’s realized natural gas pricing was an average of Midcontinent and Henry Hub Prices from 2005-2014. We know many producers sell there gas to a multitude of outlets with various transportation arrangements, but we felt this would adequately capture those arrangements on average. We also chose to ignore the impact of financial hedges on realized pricing. Hedges provided significant cash flow contributions in 2009 and 2010 as Henry Hub prices fell from $8.68/MMbtu to under $4.00/MMbtu in 2014. In addition, we assumed operators paid $1/Mcf for operating expenditures, were faced with a 20% royalty burden and paid 3% in severance taxes.
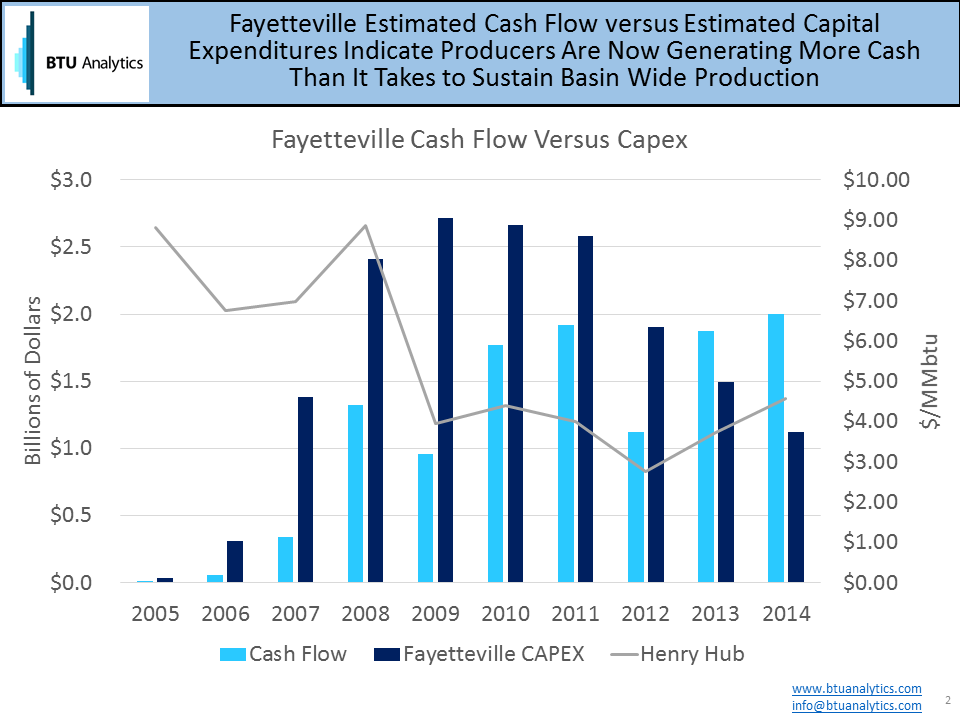
The result of all the data crunching and analysis is highlighted in the graph above. From 2005 to 2012, producers were investing in the play at a faster pace than they were generating cash, the marquee of any capital intensive business. By 2012, producers had invested by our estimate almost $6.5 billion more than they had received back. But in 2013, that trend switched, producers are now generating cash in excess of capital expenditures in the play and we estimate producers have earned over $850M in excess of capital expended to maintain the long tail of production in 2014 alone. At that pace, it will take producers just 6 years to make up the current deficit. Whether you believe shale is a 10 year blip on the radar or a revolution that will have economic impacts for a 100 years to come, it looks to me like the Fayettevile shale at least was a positive investment for the North American Energy market.


