As E&Ps are gearing up to release their 2021 activity plans and budgets, rig counts have continued to gain momentum as oil prices reach new highs. With US horizontal rigs expanding for their 18th straight week last week, our clients frequently ask us how much further we expect rigs to expand and what that means for US oil production. The short answer: more. However, the real answer is more complex than that. As we have highlighted in the past, rig counts alone don’t always paint an accurate picture for future production but can inform us on directionality. One of the big missing pieces in an analysis based solely on rigs is how one might expect DUCs to be treated over that timeframe. This analysis attempts to adjust for that, by factoring in the amount of DUCs that BTU Analytics expects will be completed over the next two years.
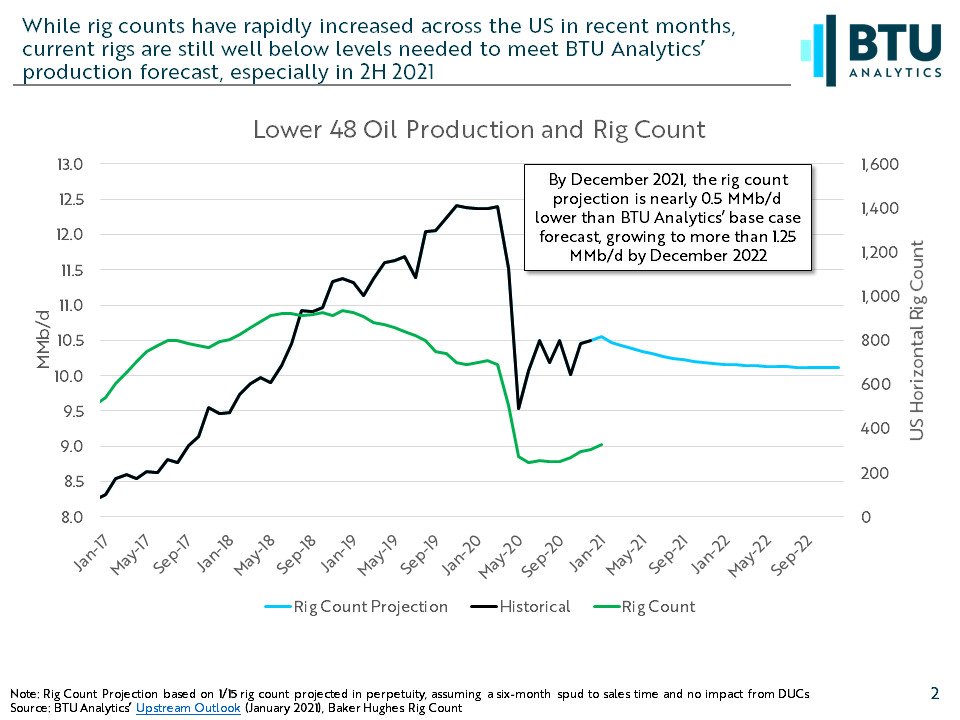
Over the past 18 weeks, horizontal rigs have increased by an average of 6.6 rigs each week. That is a considerable expansion given that horizontal rigs nearly dipped below 200 this summer. However, this level is still a far cry from what is needed to even hold current production levels flat through the year, as illustrated in the chart below. The chart shows a production scenario that holds the current rig count flat in perpetuity and assumes that wells drilled will be completed on a six-month lag, as well as the horizontal rig count in the US.
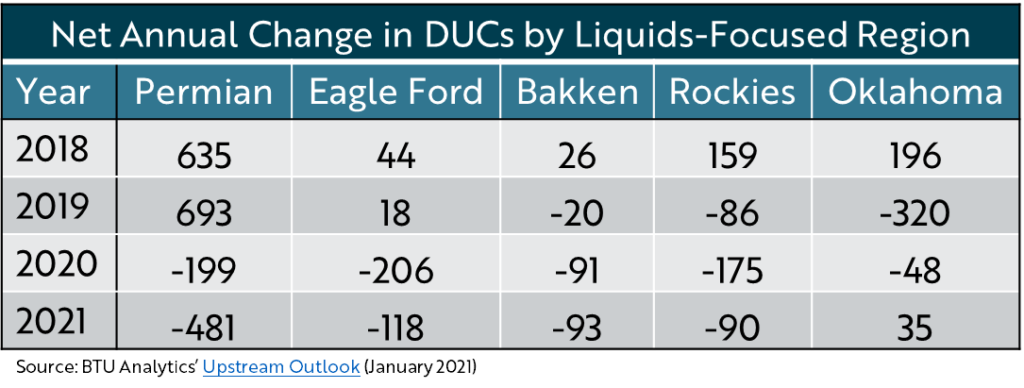
In times of rapid expansion, DUCs generally rise, meaning that production forecasts based on rigs might overestimate production. In a challenging market, much like today’s oil market, producers may draw on DUCs to utilize capital that was previously sunk to support production, resulting in a rig count that underestimates future production. In fact, BTU Analytics expects the majority of liquids-focused regions to draw on DUCs in the near-term, as is illustrated in the table below. The majority of this reduction in DUCs comes from the Permian, which BTU Analytics expects will continue to drive US oil production, even as the new Biden Administration has put a 60-day freeze on new drilling permits and leases across US federal lands, impacting New Mexico.
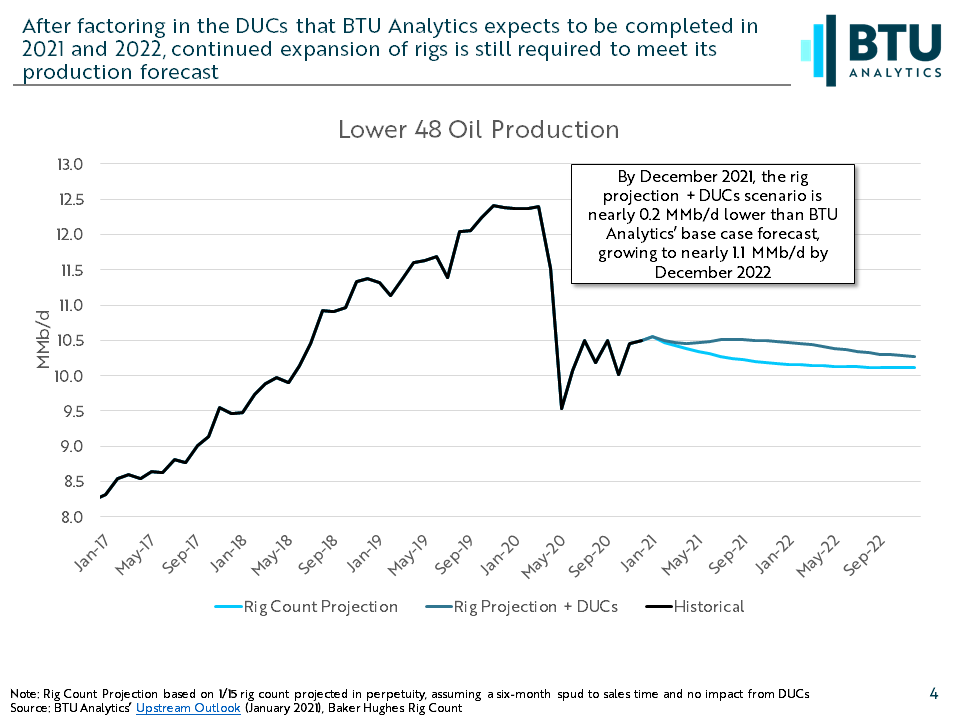
While rigs are an important piece in the production forecast puzzle, the significant balance of DUCs present across multiple liquids-focused regions need to be considered. But after factoring these DUCs in, more expansions in drilling activity are necessary to meet BTU Analytics’ base case forecast. To see BTU Analytics’ forecasts for activity, and the regions that are expected to lead the way, request a copy of the Upstream Outlook today.