Before drilling a well an operator must receive a permit from a regulating body, which is usually state specific. As this is an initial step in the regulatory life of a well, you would think analyzing permit data would provide a good leading indicator of where activity, and thus production, is headed in a region. However, having a permit does not necessarily mean a well will be drilled there, or what the timing will be if it is ultimately drilled, and in fact, looking at aggregate permit data can instead reflect nuanced regulatory issues rather than be directly predictive of activity.
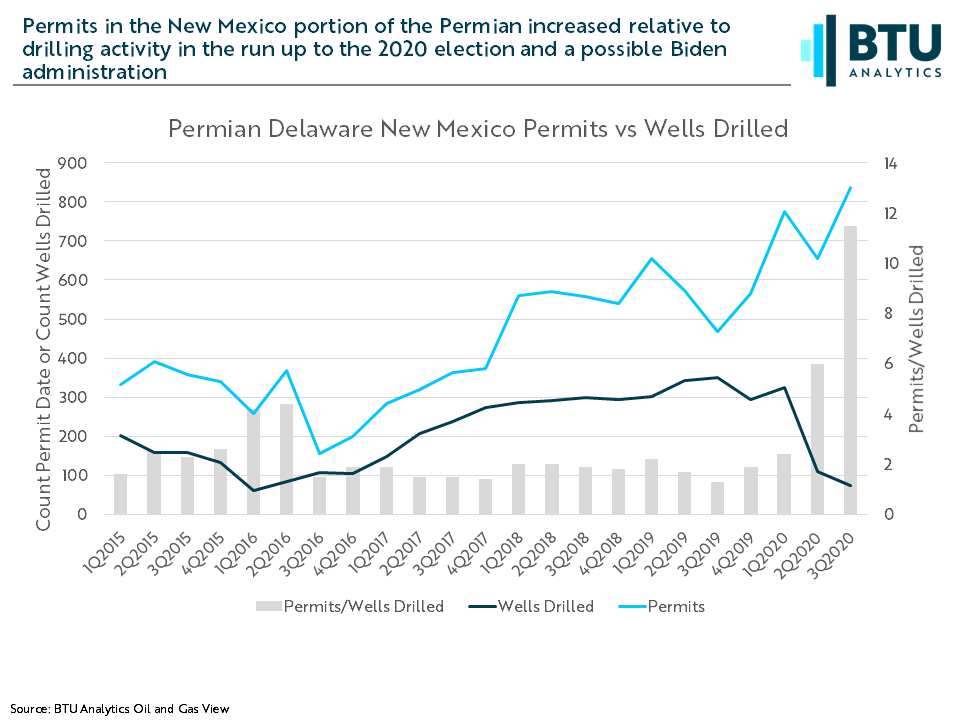
A tangible example of this is looking at permitting trends in the New Mexico portion of the Permian, where there is drilling activity on federal Bureau of Land Management (BLM) lands. This is particularly relevant given President Biden’s recent executive order suspending new oil and gas leases on federal land. Prior to the election, we discussed the trend of increasing percentage of permits filed on BLM lands in the Permian. Looking at macro permit counts versus drilling activity in the New Mexico portion of the Permian, permit activity increased through 2020, while drilling activity fell off sharply due to turmoil in the oil market related to Covid-19. In prior years, the relationship of permits to wells drilled was somewhat steady at about 2 to 1, though clearly, this relationship changed in 2020.
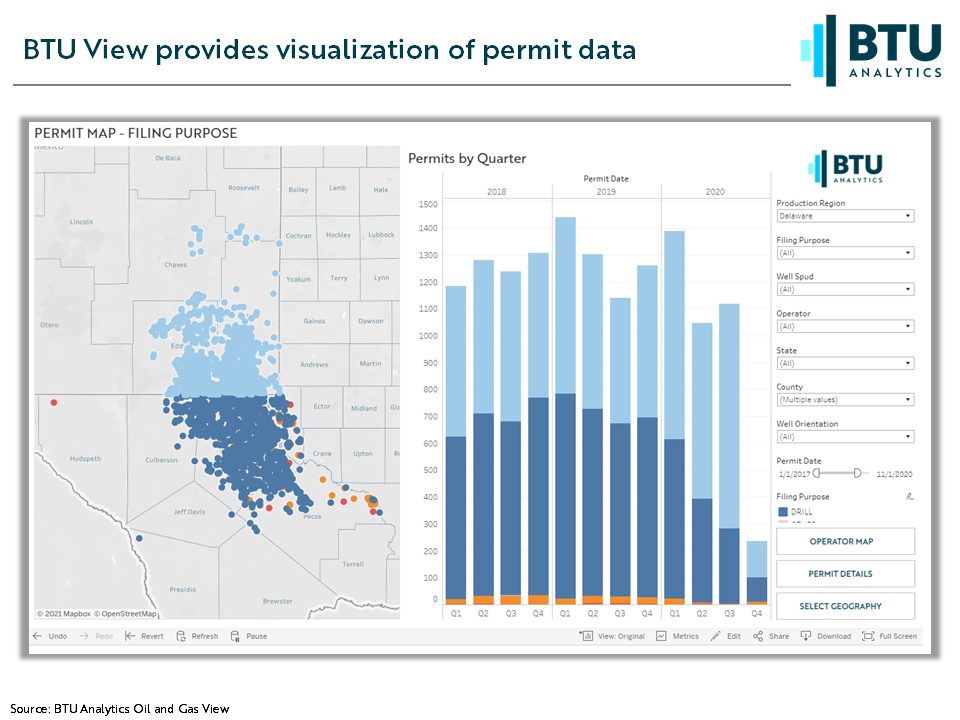
In light of the new executive order, however, a more detailed understanding of who secured these permits and where they are located may indeed help inform how drilling may develop in New Mexico over the next few years. BTU View now includes permit data, as shown highlighting the Permian below, allowing clients to visualize permit data across producing regions, by filing purpose and by operator.
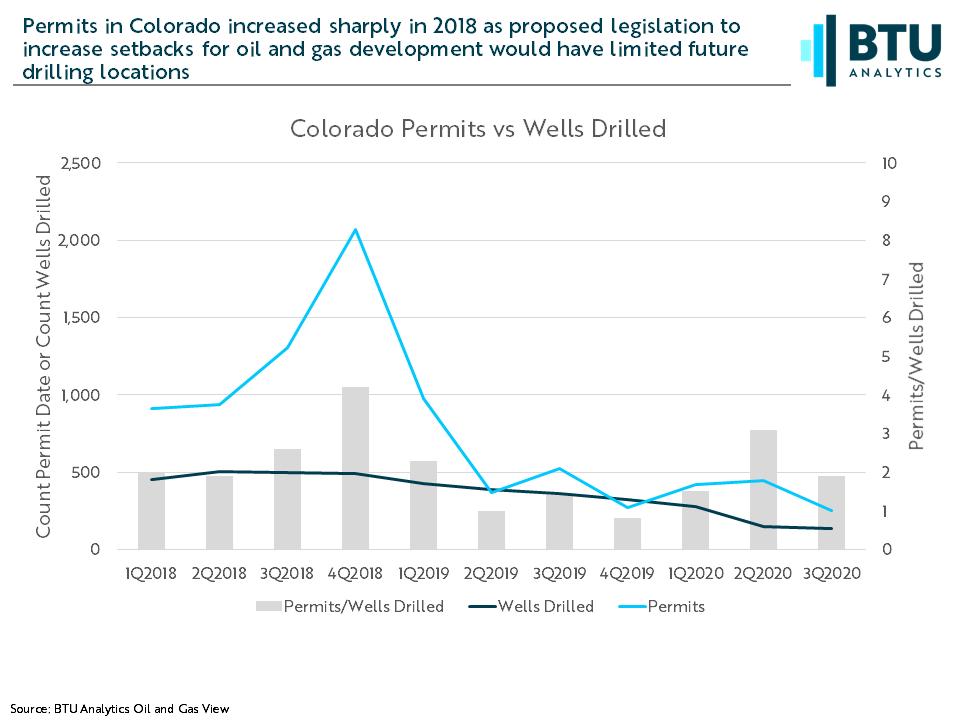
Another example worth illustrating is in Colorado in 2018: permit applications spiked materially in mid-2018 in the run up to the election due to proposed legislation to extend the setback for oil and gas development in the state, which would have materially hampered future drilling locations, as seen in the figure below. Initiative #97 which became Proposition 112 on the 2018 Colorado ballot was ultimately rejected by voters, and permit applications fell off after the 2018 election. Had this legislation passed, more detailed analysis of these permits could have shed some insight into who would be able to drill despite the new rules. However, it was not a reliable indicator of overall drilling activity.
Permit data is a tool to understand the oil and gas space, but when looking at the data it is important to understand if there are legislative or regulatory nuances that may be driving trends. To dive into this data, check out the BTU View platform. Plus, BTU clients always have direct access to BTU analysts who are readily available to help shed light on how we are interpreting the data to avoid pitfalls when drawing conclusions from the data.