Produced water seems to be one of those opaque areas of the oil and gas industry that garners little attention. However, seeing that we have been getting more and more questions from clients, we decided to look closer at the data we have on hand. First, we have seen estimates that in 2013 alone, $11 billion was spent trucking water from oil and gas fields in the US. Second, our initial review of state data indicates that the US generates over 40 MM bbls of produced water per day that would equate to roughly $0.65/bbl. Not a small expense.
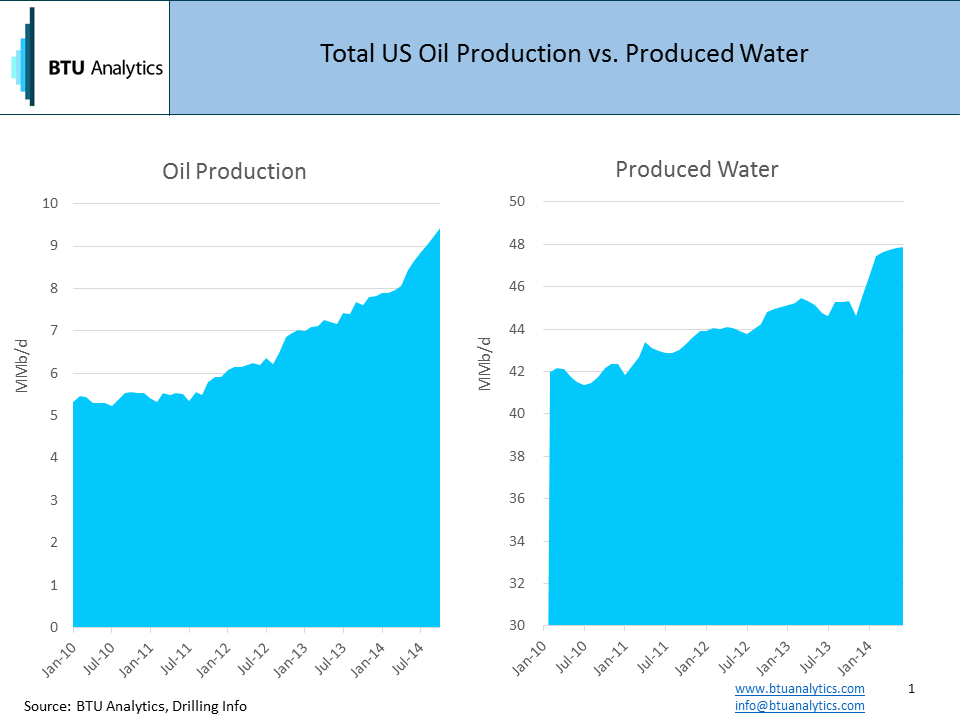
Produced water occurs during the fracking and completion of a well and in addition once the well is put into production. In this case we are looking at produced water from wells once in production. Some of this water is from the fracking process but much of it is from the various geologic formations containing oil and gas. Produced water is also more common in oil bearing formations than in gas bearing formations. If we look below, we can see US oil production has climbed from 5.3 MM bbls per day in January 2010 to 9.4 MM bbls per day in June 2014, an increase of 77%. Meanwhile produced water has increased but not nearly at the same magnitude, up 11 % from 41.5 MM bbls to 45.9 MM bbls in the same time frame.
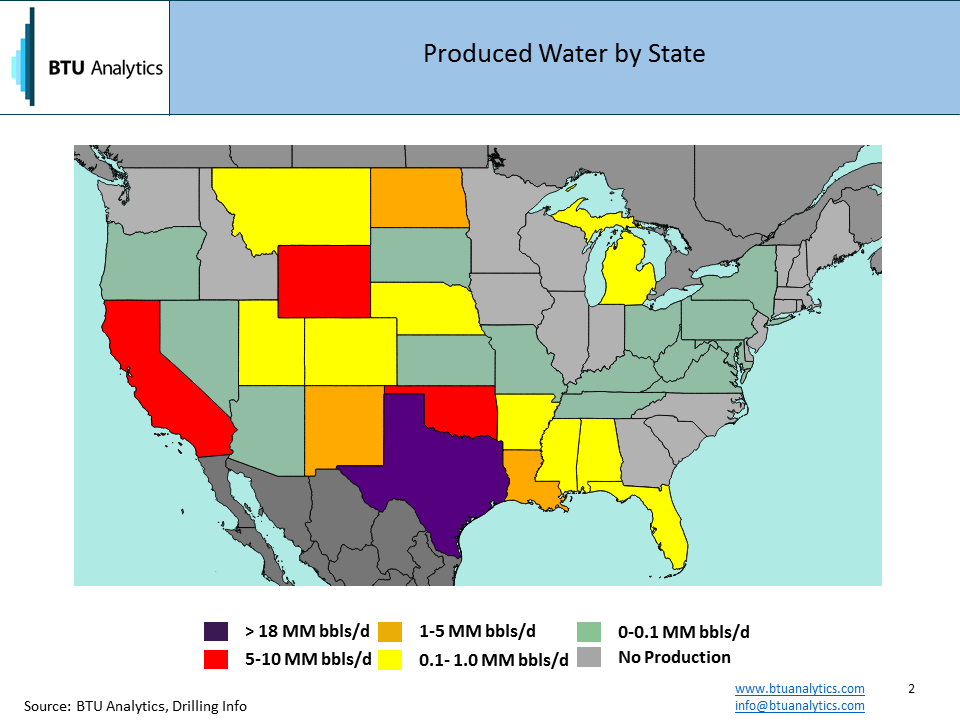
So where are the largest produced water markets? Per the map below, Texas represents 38% of total produced water in the US, followed by California, Wyoming and Oklahoma* (*Oklahoma is an estimate off of produced oil and gas ratios, while the rest of the US utilized well level data).
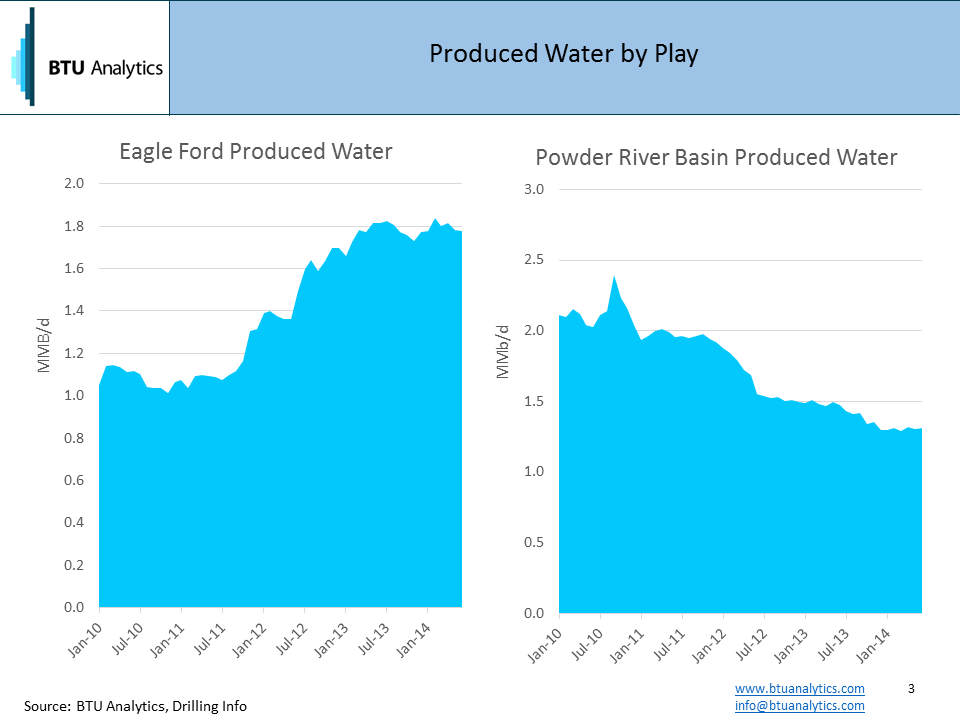
As we all know, production economics influence producer behavior, and thus we see produced water by play increase in areas of increased production activity such as the Eagle Ford, while marginal plays, such as coal bed methane in the Powder River Basin, experience declines.
So where does all the water go? In many oil plays water is injected back in the ground to drive further production, for example this is common in California. In other plays, injecting water into disposal wells is common as we have observed in Texas.
Look for BTU Analytics to spend more time on this topic in the future.