When and where will we see the most Northeast drilling activity? Which operators are going to ramp up their activity first? When are these projects in the Northeast actually going to come online? These are just some of the questions that we help our clients answer. In pursuit of those answers we look at a multitude of factors, including breakeven economics, well backlog and potential takeaway projects. But another potential leading indicator of future activity is Marcellus well permitting. While well permitting isn’t a great indicator of future activity in all regions, in the Northeast, at least, permitting is another constraint that must be considered when forecasting future production growth.
First, for the sake of brevity, our analysis of Northeast permitting trends for this commentary will be restricted to the state of Pennsylvania. The Pennsylvania Department of Environmental Protection (PA DEP) provides timely data on permit (both drilling and wellsite) filings, with current data through December 2016. Pennsylvania requires multiple permits before a well can be spud, but two that represent significant time commitments are the wellsite permit, known as the Erosion and Sediment Control General Permit (ESCGP), and individual well permits.
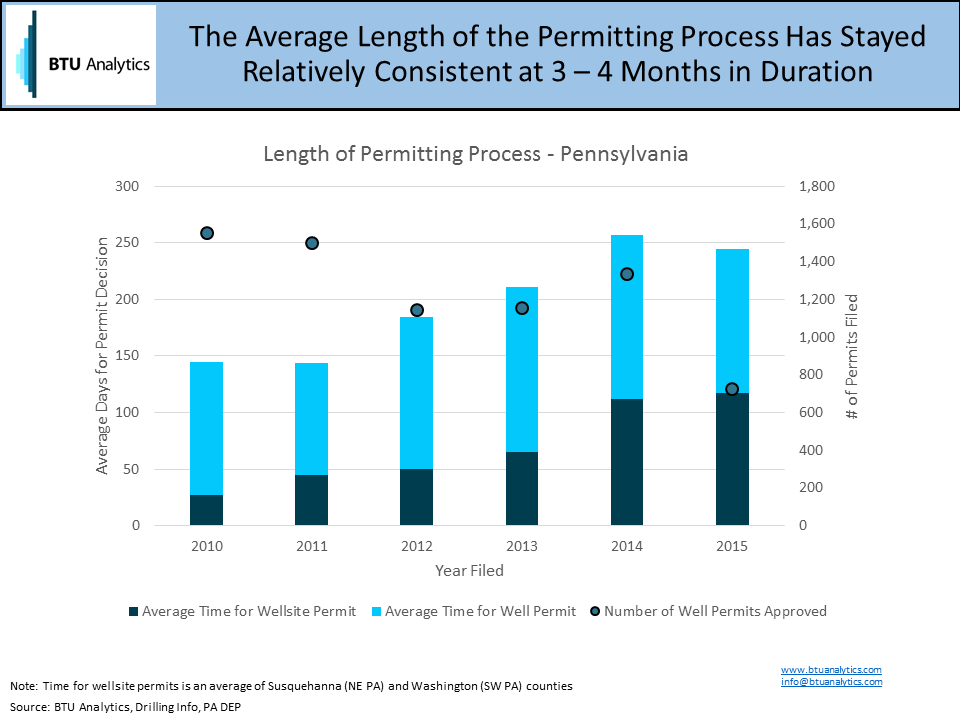
The first question to be addressed is how long does the permitting process take? Wellsite and well permits can differ in duration based on where the well is located and which of the three regional offices handles the process, with the southwest region having the longest average duration for a permit resolution. The below graphic shows that the duration of the permitting process has become more time consuming since 2011, being driven mainly by increases in time needed for wellsite permits, while drilling permits have remained relatively steady, bouncing between three to four months.
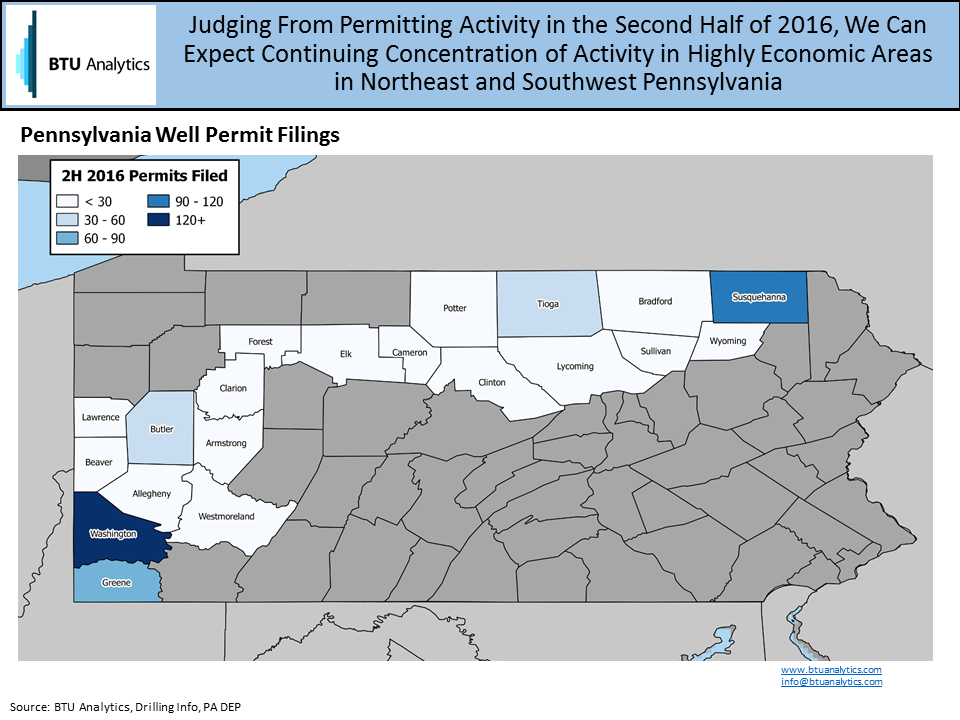
Not only can this data help inform our overall production forecasts, but plotting permit locations gives us an indication of where wells are more likely to be drilled in the near term. The below map plots permit filings from the second half of 2016 and shows that drilling activity is likely to continue to focus on the most economic areas of Northeast and Southwest Pennsylvania.
What about at the operator level? Some major pipeline projects have announced in-service dates this year (although we have some thoughts on that) including Rover, NEXUS, and Columbia Pipeline Group’s Leach and Rayne Xpress. Given the lead time required to bring a well to sale, and the exhaustion of backlog, if an operator believes new projects will be coming to market, we should be seeing increased permitting activity to meet upcoming commitments in 2017.
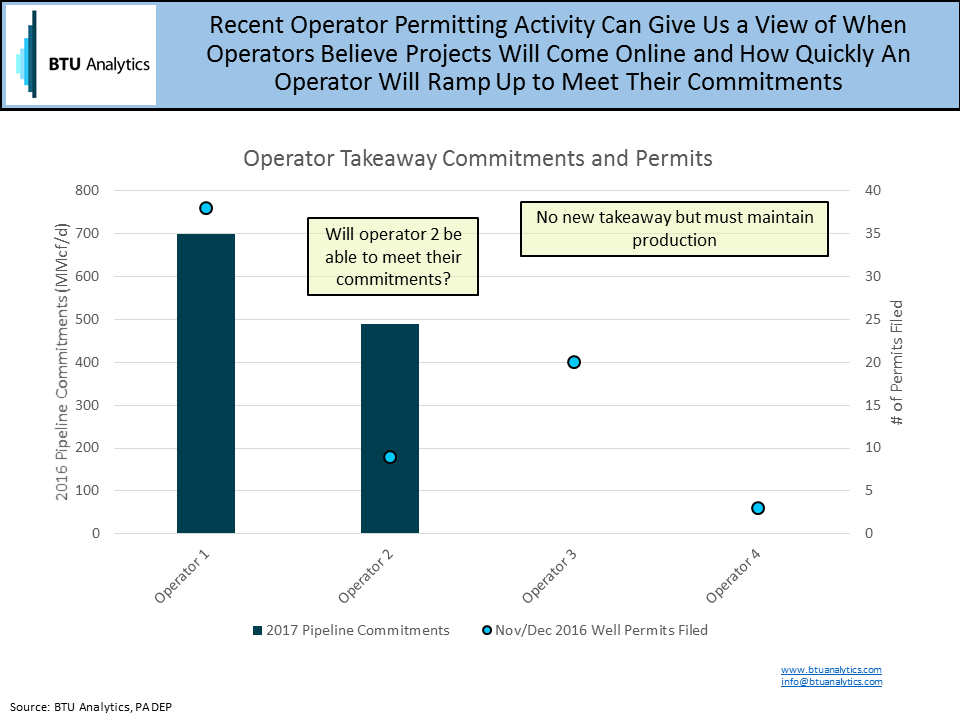
Combining these permitted wells with known locations and representative type curves can give an approximation of production potential that can be brought to market in ten to twelve months.
Permits provide valuable insight as a leading indicator of dynamics we can expect in the future both on a macro, regional level and at a granular, operator level. For more on what these indicators portend for the Marcellus and Utica, as well as the market as a whole, join us at our upcoming conference What Lies Ahead 2017.