The era of substantial backlog in the Marcellus and Utica is drawing to a close as inventories continue to dwindle. For the past few years, operators in Appalachia have relied on these inventories of DUCs (drilled, uncompleted wells) and COBs (completed wells on backlog) as low-cost sources of production. While that crutch for producers will be gone shortly, it must be said that backlog is never going to be gone for good. First of all, there is a natural working backlog of about 6-9 months in the Northeast that will persist. But even excess backlog, which are any wells in backlog beyond 6-9 months, is expected to persist. So how can we have both the end of backlog, yet inventories of excess backlog persist? Turns out like in many other industries, location is key.
Let’s use Pennsylvania as an example since they provide the most frequent and up-to-date information. BTU Analytics breaks Pennsylvania into four distinct areas: Northeast PA, Central PA, West PA, and South PA. The map below shows those four sub-locations with their current excess backlog that BTU models during the forecasting process for our Upstream Outlook and Northeast Gas Outlook.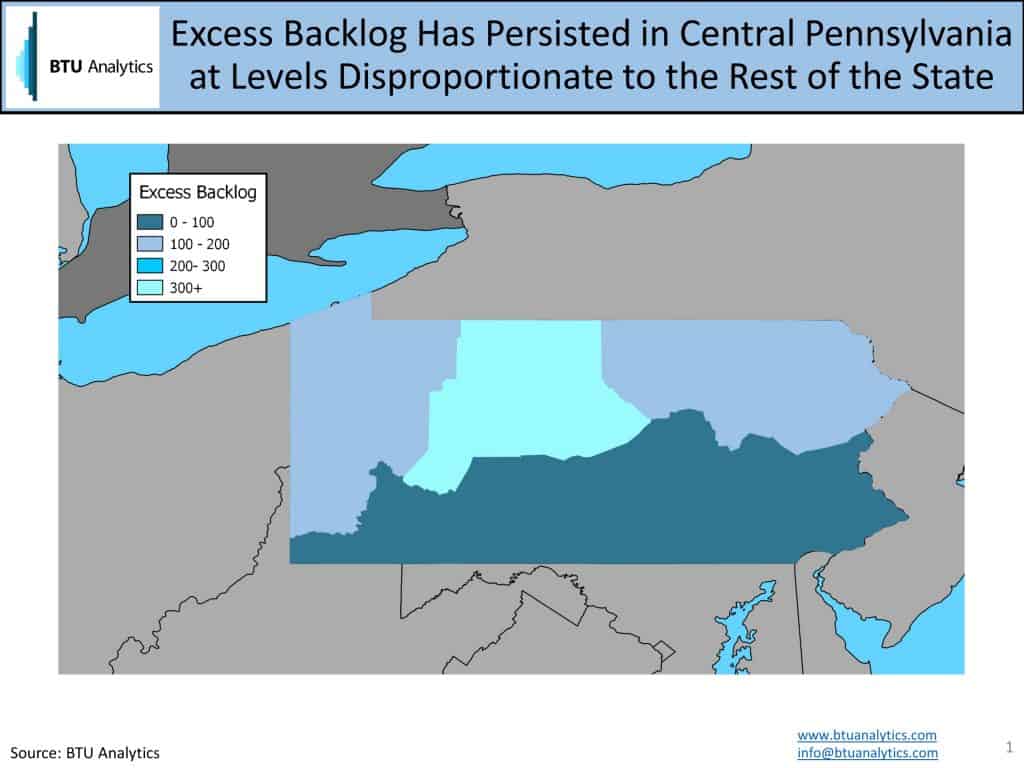
As you can see, a disproportionate amount of backlog resides in Central Pennsylvania, an area not known for favorable natural gas economics, and especially challenged in the low-price environment Pennsylvania has been experiencing for some time. Economics plays a major role on how backlog is drawn down. Why spend the capital to complete a well that might have been spud in 2014, when more prolific wells can be drilled and completed today?
Looking back in history we can see how this situation evolved to get us where we are today. The graphic below gives an historical look at excess backlog levels by region.
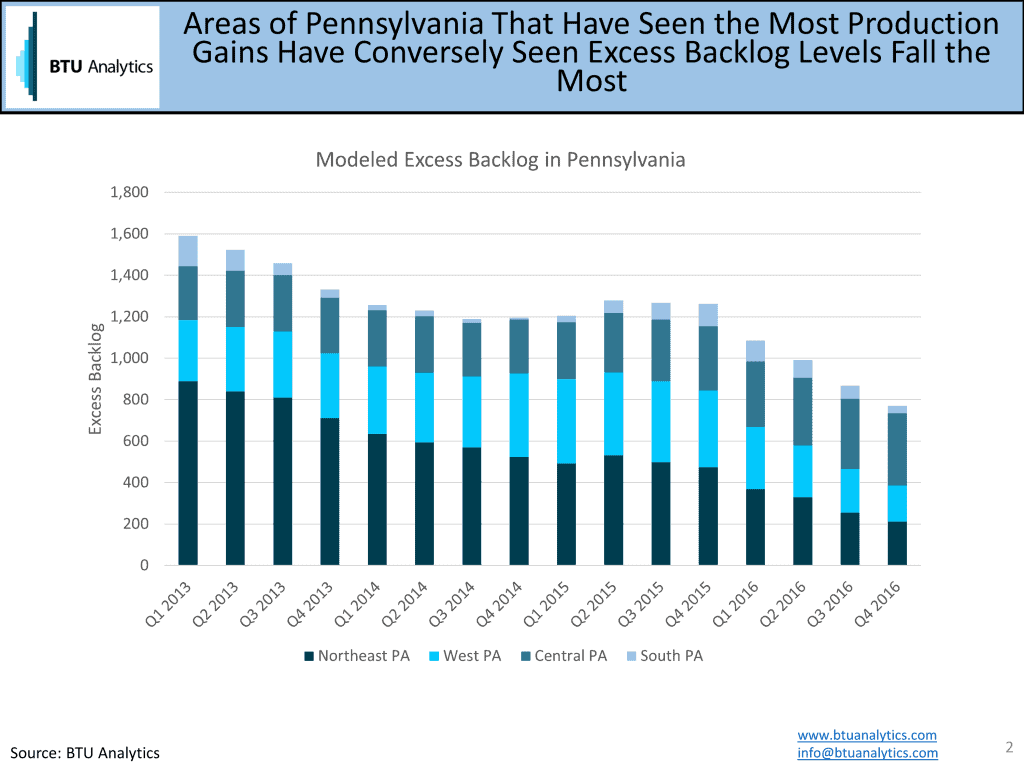
The most striking characteristic about the above graphic is how far excess backlogs have fallen, from 1,600 in 2013 to less than half of that in the fourth quarter of 2016. The second characteristic to note is not all regions shared in the decline equally. Northeast Pennsylvania has shed the most excess backlog inventory, while Central Pennsylvania has remained essentially flat. Production trends have shown a similar disproportionate pattern with Northeast Pennsylvania production growing 7.7 Bcf/d since 2010 and Central Pennsylvania growing only 0.2 Bcf/d.
While we have been talking exclusively about Pennsylvania, this same concept applies to parts of Ohio and West Virginia as well. So, is the age of backlog coming to a close? Yes, backlog, where it matters most, will soon be depleted, meaning rigs will need to pick up the pace in some places. However, remnants of the bygone era will always remain.
For more details on the impact of backlog drawdown, request a sample of our Upstream Outlook or our Northeast Gas Outlook.