US shale has proven its resiliency over the past three and a half years, emerging as the chief driver of record US crude production in a rising price environment. But as US production continues to push new bounds, infrastructure constraints beyond the wellhead continue to hamper the pace of US growth. Constraints to oil pipeline infrastructure have been well documented and numerous pipeline projects are underway and destined for the Gulf Coast, especially out of the Permian Basin. But what happens when the logjam breaks and all that incremental crude gets to the Gulf? One of the most important outlets for crude supply was opened in 2016– crude exports. But as we’ll discuss today, there are sizable headwinds to current dock capacity that must be overcome to handle significant export growth.
First, let’s look at how much crude could make it to the gulf. The chart below shows the balance, over time, of US crude supply sources (US production, Canadian imports, and waterborne imports) to demand sources (US refining throughput, exports to Canada, and waterborne exports ex -Canada). On the supply side, BTU Analytics forecasts that US oil production will average almost 14 MMb/d in 2023, a 29% increase over the 2018 average of 10.8 MMb/d. This growth of domestic crude is exacerbated by increasing Canadian production, where stagnant domestic demand and difficulty building new pipelines could send incremental barrels into the US as exports. Holding waterborne imports flat over time, the total crude supply in the US would reach an average 22 MMb/d in 2023.
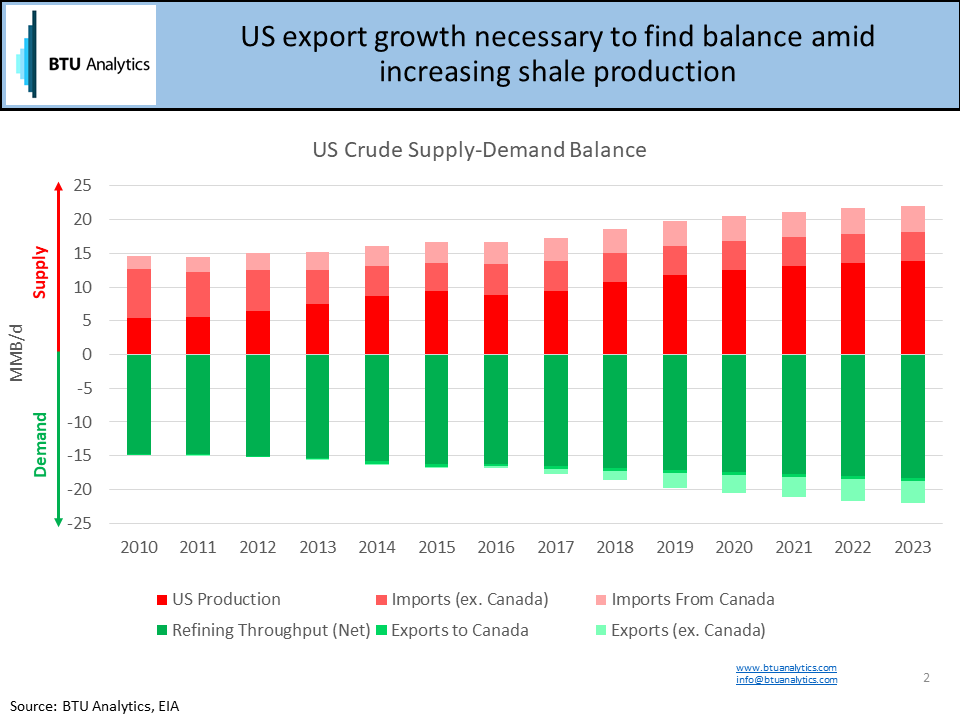
The most significant demand source for US crude supply is from refiners. Currently, refiners are absorbing significant levels of light crude, given the spread between WTI and Brent. However, there are limitations to how much light crude they can handle because of their design to run heavier crude and the differences in yields and margins of refined products across different crude slates. Assuming annual growth of around 1.7%, refining throughput would reach an average of 18.4 MMb/d in 2023. It’s important to note that this percentage is based on the average percent growth the US has seen over the last three years and does not explicitly include specific projects like the potential refinery expansions by Exxon (addition of crude distillation unit at Beaumont refinery to handle more US crude) and Motiva (possible expansion of Port Arthur refinery by 400-900 Mb/d). At 90% utilization, these projects could add 5.6% to average net throughput over the last 12 months. Excluding exports to Canada, which would run through separate infrastructure and are assumed flat, the remainder of supply growth from US production and Canadian imports must then be exported, primarily through the Gulf. This would mean that US crude exports would need to ramp from an average 2 MMb/d over the past eight weeks to more than 3.3 MMb/d in 2023.
This level of growth over a five-year period seems even more daunting when considering the current infrastructure in the US to export crude. For longer hauls to China and Europe, where most US export growth has been seen, the most economic option to export crude is using Very Large Crude Carriers (VLCCs), which hold approximately 2 MMbbls. Only one port in the Gulf Coast can fully load VLCCs, the Louisiana Offshore Oil Port (LOOP). However, LOOP has its own constraints limiting the facility’s ability to consistently export crude. The port is also used to import heavier crude for regional refineries and is limited in its ability to source growing shale supply until Energy Transfer’s Bayou Bridge pipeline is completed, linking crude sources in Nederland, Texas to St. James, Louisiana. Bayou Bridge is currently caught up in a legal battle over permitting.
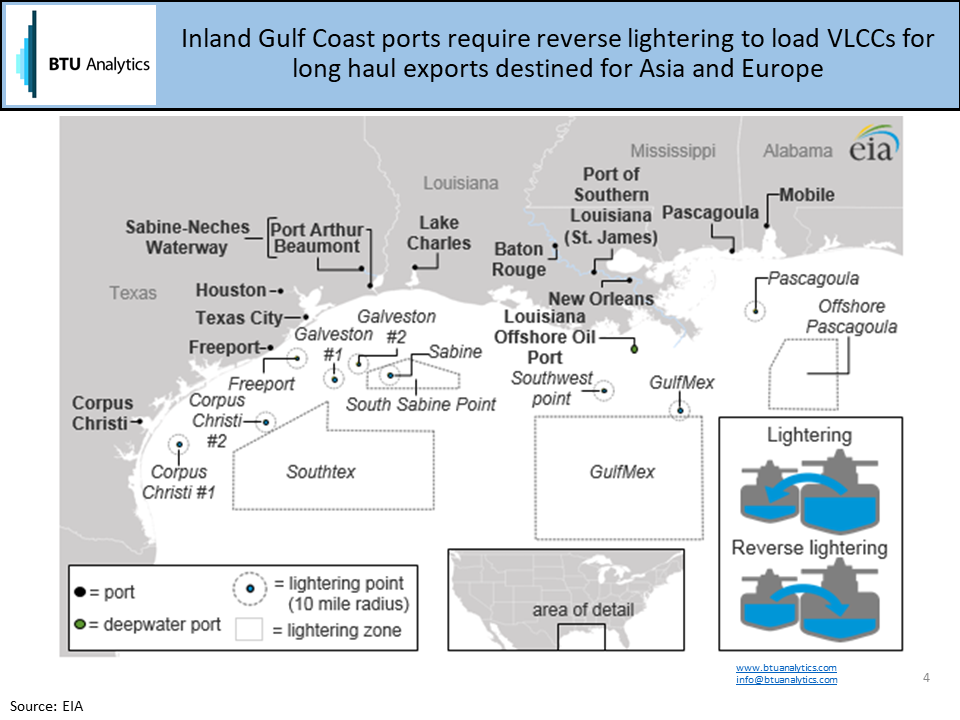
The inability to directly and fully load a VLCC forces US exporters to utilize reverse lightering or loading a VLCC via multiple trips taken by smaller tankers (Suezmax and Aframax-sized tankers) that can adequately navigate the Gulf Coast’s inland ports. This is illustrated in the map below provided by the EIA.
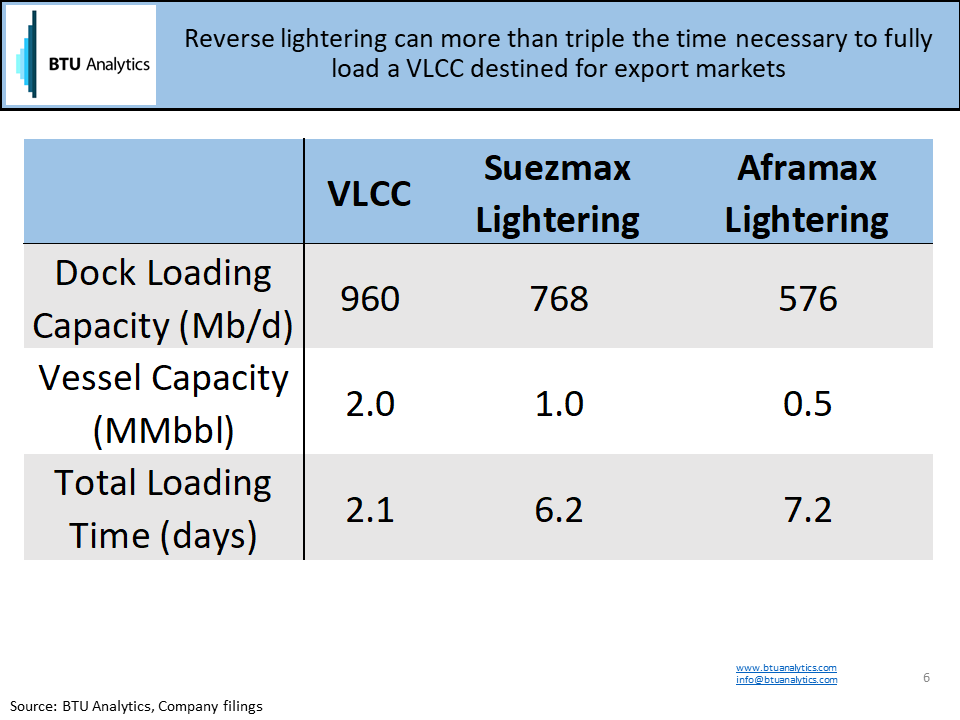
Given that lightering requires multiple trips by the smaller vessel to fully load a VLCC, direct loading provides both a time and valuable benefit to the exporter, thus narrowing the spread between WTI and Brent needed to make US crude profitable to export. The table below shows the amount of time it takes to fully load a VLCC versus lightering from a Suezmax or Aframax-sized tanker. Based on hourly loading rates from various US ports able to load Suezmax and Aframax vessels, reverse lightering a VLCC can take between six and seven days total. Port congestion would only exacerbate this timing. Directly loading a VLCC, on the other hand, could take as little as two days.
Exporters are aware of this problem, however, and are beginning to find other options. Occidental Petroleum (OXY) test-loaded a VLCC at its Corpus Christi facility last year, filling it about 60%. OXY plans to expand the draft at its facility from 45 feet to 54 feet by the end of 2018 but would need a draft of 66 feet to fully load a VLCC. Buckeye Partners, Phillips 66, and Andeavor formed a joint venture to build a loading terminal near Corpus Christi with two deep-water docks capable of handling VLCCs, which could be completed between 2020 and 2021 if permitting proceeds without material delays. Additionally, Jupiter MLP has begun permitting for an offshore VLCC loading dock near Brownsville, similar to LOOP, but wouldn’t be completed until 2020 at the earliest.
Expanding Gulf Coast ports to handle VLCCs is important for growing US crude to find a home because domestic demand growth is limited. Without these port expansions, or if project timelines start to lengthen, US crude could flood the Gulf Coast and drive further dislocation between WTI and Brent pricing. Where do we see the Brent-WTI spread trending over the next five years? How do we see US crude affecting the international markets? Request a sample of our Oil Market Outlook today for the answer to those questions and more.