The Utica is again in the headlines, with Shell (NYSE: RDS.A) announcing new wells testing the eastern extent of the play, and Eclipse Resources (NYSE: ECR) announcing impressive rates in Monroe and Harrison Counties.
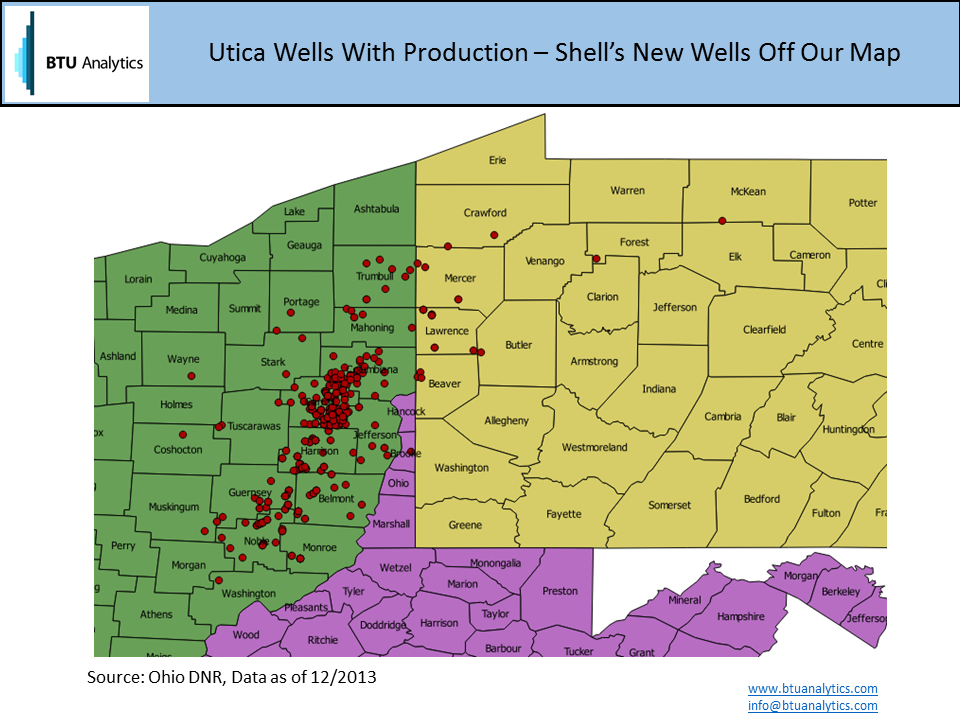
On Tuesday Shell announced production from two Utica wells drilled in Tioga County, PA. Didn’t anyone tell Shell that we already have plenty of gas resources in Northeast Pennsylvania? BTU Analytics had just put together a map showing the location of horizontal Utica/Point Pleasant wells with production, and Tioga County isn’t even shown on the map as its over 200 miles from the heart of activity in Carroll County, Ohio. That’s how far these two new wells are from other Utica activity.
While investors are inundated with initial production rates and fancy charts created by producers, the market is still lacking the transparency to corroborate that data across large swaths of the play. The chart below shows Ohio Department of Natural Resources data for gas production from individual Utica wells plotted against days on production and sorted by county, versus cumulative production curves assembled from producer reported data by BTU Analytics. In a world with perfect, transparent data and unconstrained infrastructure, the dots representing individual well results would cluster around these curves. However, we see that the data has come in much lower than we might have expected. Why could this be?
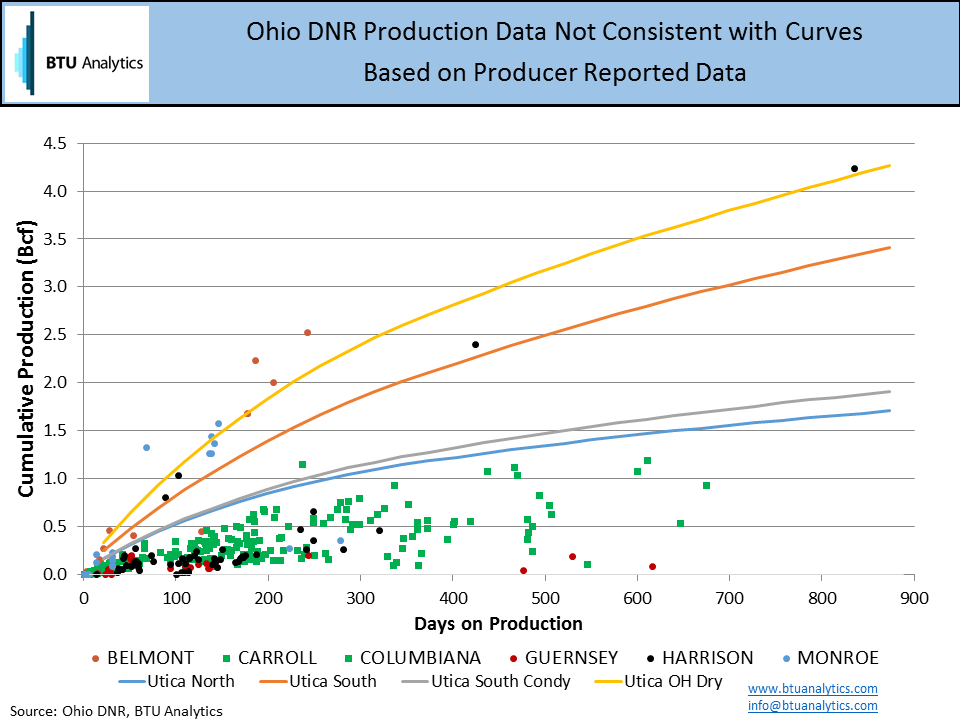
One potential reason could be that the curves being posted by producers represent expected results for wells that are being drilled today, which may have improved results due to learnings about play sweet spots, completion techniques and other factors. Lagged reporting by the state would mean that we might not see that improvement for another 12-18 months. Another potential reason could be infrastructure. The productive potential of these wells may not be evident in the state production figures if the wells are choked back due to gathering, processing or takeaway constraints. The third reason could be that producers are overly optimistic about the play’s potential. However, the rate of gas production for the state of Ohio seems to discredit that last point.
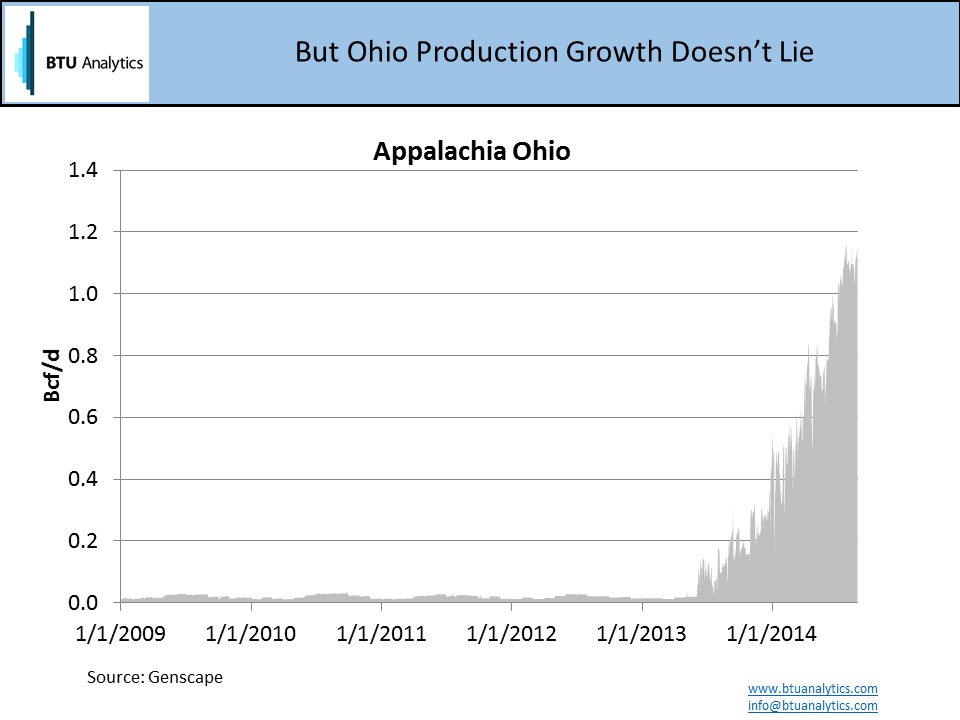
low data from Genscape shows that production in Eastern Ohio (Which falls in BTU Analytics’ Appalachia Ohio production reporting region) grew from negligible to 1.1 Bcf/d in the past year. Add to that production that isn’t seen on the interstate pipes, and Utica production is now 1.3 Bcf/d. So while individual well performance lacks the transparency for a thorough area by area analysis, the play in aggregate has grown to the point where few can argue its status as a major growth area in the North American market.