


When doing any kind of modeling or forecasting, it’s always nice to have an external data source to check against. At BTU Analytics, one of our most detailed models is our production model. In order to model production, we look at a number of different factors, including well counts, rig counts, completion data from FracFocus, type curves in both horizontal and vertical wells, as well as historical production and well level economics. All of this is done in over 90 different sub locations that make up US and Canadian production. As you can imagine, forecasting all of these different pieces in over 90 sub locations requires a fair amount of external checks. These checks include FracFocus, state level production data, EIA production (specifically EIA 914), as well as gas flow data from pipelines. In most cases, the check is simple enough. However, sometimes we run into numbers that are directionally opposite of what we expect. Such was the case in November when the EIA released their Texas gross gas production numbers.
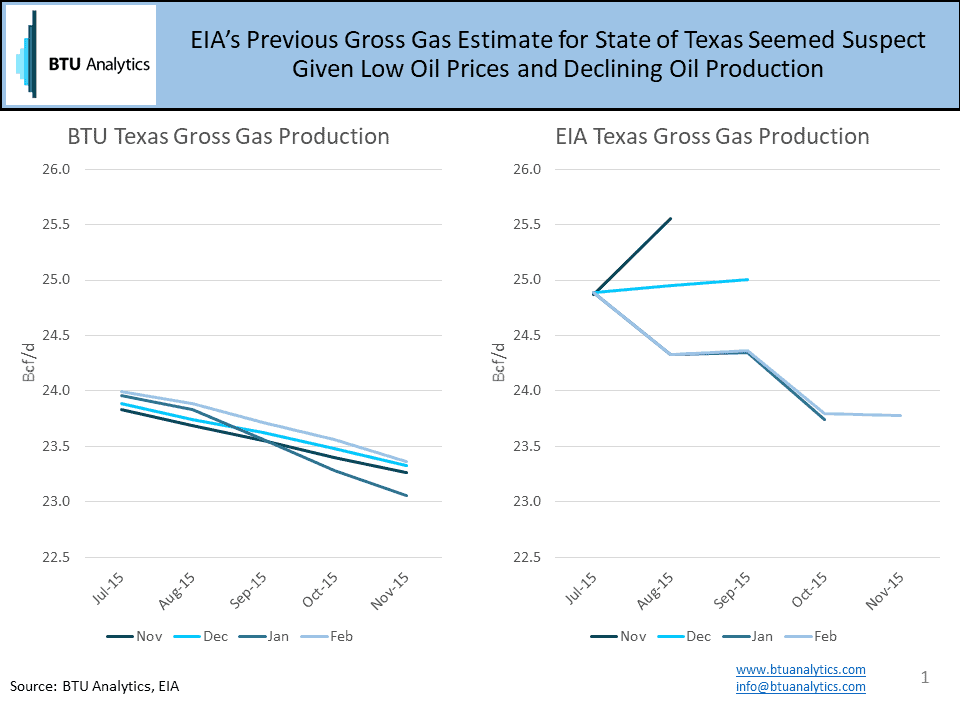
The above graphic is telling of the problems that can arise. What you can see is a comparison of the BTU Analytics’ gross gas production forecast in Texas versus the EIA production estimate numbers according to the month that those numbers were released. When the EIA first released that November outlook, we saw a jump of almost 1 Bcf/d of gas production in Texas in July to August. When we compared this to our numbers, we saw that the BTU model was directionally different from the EIA numbers, and by a substantial amount, as we had the July-August change actually showing a decrease in production.
Normally, this would be cause to try to find any other data set to check against (the only external data source for checking Texas gas production is the EIA, since the natural gas pipeline flow sample is so small), however we suspected that the EIA number was not in the correct direction for one big reason; the fact that oil production in Texas was declining over the same period. Both BTU and the EIA had declining oil production in the state for the same time frame (July to August), and the only way that production could have jumped was if massive gas wells were coming online that had no oil production. Since we knew the main dry plays in Texas (Barnett, Haynesville) were not seeing increased activity, we suspected that this directional jump was incorrect. By December, the EIA revised the number down, but was still seeing an increase. Finally, in January, the EIA July-August production number was revised down in a direction that we would expect to see with declining oil production in a state where the current economics of drilling are driven primarily by oil prices.
In order to get a deeper look at BTU Analytics’ outlook on production, check out our Upstream Outlook, or if you want to try some of the tools that BTU Analytics’ uses to model production, sign up for our Production Tool for free.


