


As Permian production continues to grow and pipeline capacity out of the region becomes increasingly constrained, one question that keeps surfacing is to what extent flaring could help mitigate the gas takeaway problem. Permian drilling activity is primarily driven by oil economics and with WTI prices back in the $70 range, producers are incentivized to grow oil production. However, pipeline constraints on the gas side may hinder growth in oil, with natural gas in the Permian quickly becoming an unwanted byproduct. So could flaring provide substantial relief to the current takeaway constraints?
The Railroad Commission of Texas (RRC) currently allows flaring during drilling and up to 10 days after well completion. In addition, flaring permits can be issued for 45 days, with a maximum limit of 180 days, for various reasons such as gas plant shutdowns, maintenance, and the lack of takeaway capacity. It is this last point that could become relevant in the second half of 2018 and into 2019 as gas production bumps up against takeaway capacity until new pipelines are completed out of the Permian. The Texas RRC data shows that in 2016 the percent of gas vented or flared statewide was only 1% of total gas production. This corresponds to 4,900 flaring permits out of over 300,000 active oil wells for the same period. While this is just a small fraction of overall activity, it is not an insignificant amount of volume. The chart below shows Texas flaring data for the previous three years through the most recent data of November of 2017.
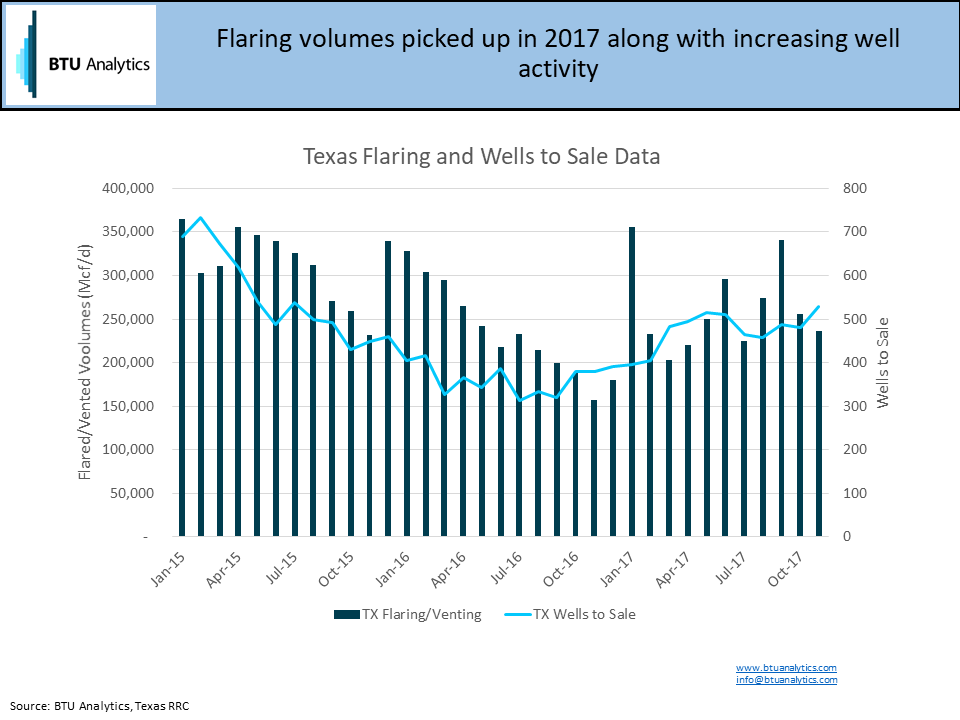
Overall volumes of flared and vented gas averaged 313 MMcf/d in 2015 and 235 MMcf/d in 2016. As can be seen above, this correlates to what Texas drilling activity was doing during that period. Last year, as we began to see stronger drilling activity return, flaring also picked up again with 2017 average volumes over 250 MMcf/d. Thus far into 2018, activity in Texas, and especially the Permian, has continued to increase and all else equal we would expect to see flaring volumes do the same as more data comes in.
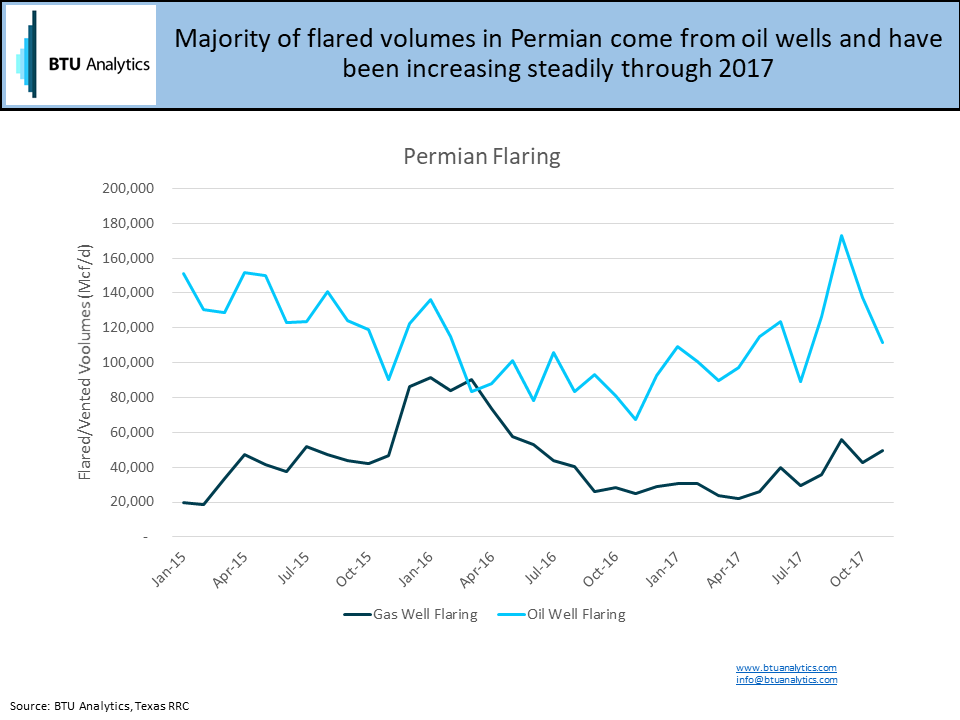
The following chart looks at the Permian contribution to the overall Texas flaring. Districts 7C, 08, and 8A were used to represent the Permian volumes based on the Texas RRC regional breakouts. The majority of all volumes however are from the 08 district. Volume wise, casinghead flaring from oil focused wells are the primary driver. Although flaring from gas wells also ramped through 2017.
As is usually the case with production data, there is a significant lag for what is available. However, infrared data from nighttime satellite passes provides real-time monitoring that can supplement the state and government level detail available for analysis.
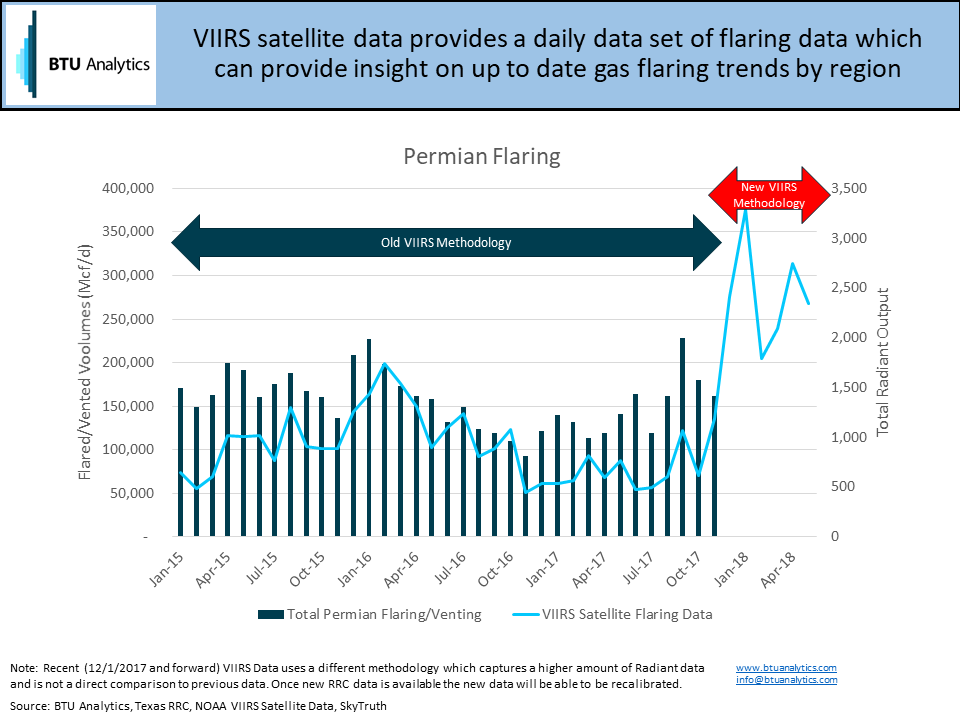
The subset of data used to isolate flaring detail was made available from SkyTruth, a group that uses satellite imagery to motivate people to protect the environment, and includes many assumptions which help separate flaring data from forest fires, biomass plants, etc. The relevant data to Permian flaring was broken out from the larger data set to create the chart above, which overlays the VIIRS data with total Permian flaring from the Texas RRC. The general trends over the past 3 years line up fairly well, although the VIIRS data would not capture gas that was vented instead of flared. Overall, this provides a strong tool to monitor current trends as data is collected every day. Unfortunately, however, VIIRS data from 12/1/2017 to the present uses an updated methodology which captures a higher amount of radiant heat. Therefore, data from 12/1/2017 to the present is not directly comparable to the previous data and RRC data. Calibrating the newest data to 1H 2018 RRC data once available will allow for up to date flaring information on an ongoing basis.
As the second half of 2018 unfolds, any increase to flaring in the Permian basin could help provide some relief to an increasingly congested gas pipeline system. However, even if flaring were to double from current volumes, that alone wouldn’t solve anticipated Permian gas constraints. For more information, please request a copy of the US Upstream Outlook Report.
Sources:
Elvidge et al. “Methods for Global Survey of Natural Gas Flaring from Visible Infrared Imaging Radiometer Suite Data.” Energies 2016, 9(1), 14


