With WTI settling above $50/bbl much of this week, many in the industry are beginning to consider what the market recovery might look like. In June 2014 crude oil was trading at $106/bbl and 1,250 horizontal rigs were drilling over 1,700 new horizontal wells per month. Since that time we’ve touched $26.21/bbl and recovered to $50/bbl this week. Rigs bottomed to 314 before posting a gain of five rigs last week. A number of producers have indicated that they would consider increasing drilling activity in a $50/bbl crude environment. But what level activity will it take to stem US oil decline and when will we get there?
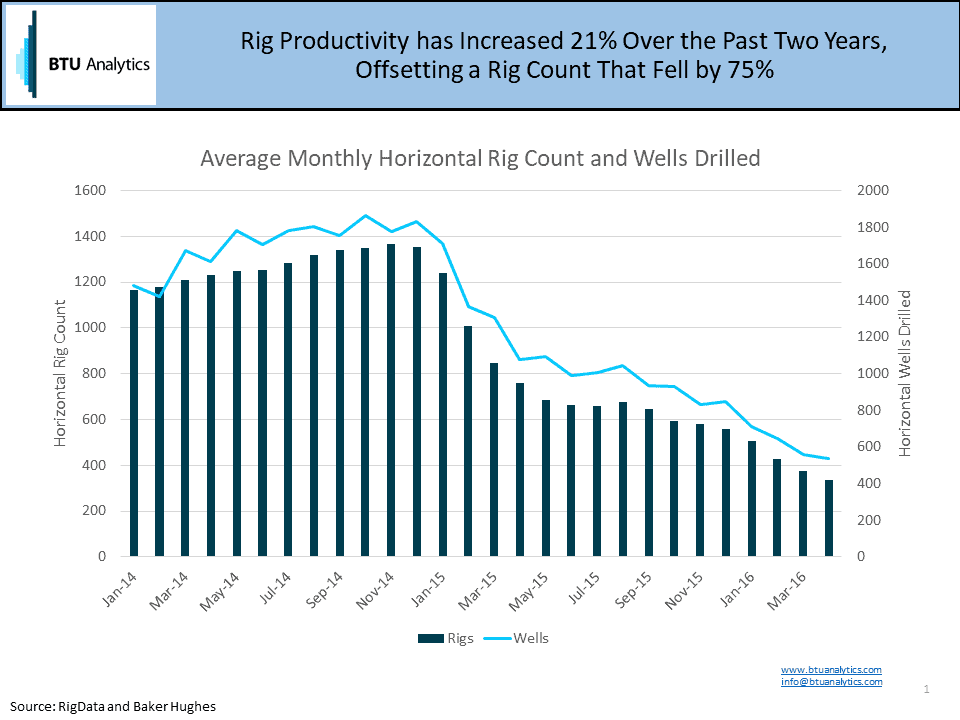
The chart above shows the relationship between the number of rigs versus the number of wells drilled per month. As producers have attempted to squeeze out every available efficiency, the relationship between rigs and wells has changed significantly. This is one of the reasons we don’t advocate using rigs as an input for forecasting over the medium- to long-term.
The current relationship between rigs and wells is that a single rig can drill approximately 1.6 wells per month. At that rate, how many rigs will we need to add to bring US L48 production declines to a halt? Not as many as you might imagine. Despite losing over 930 rigs from the field over the past two years, only 100 additional rigs are needed to flatten out the US production profile.
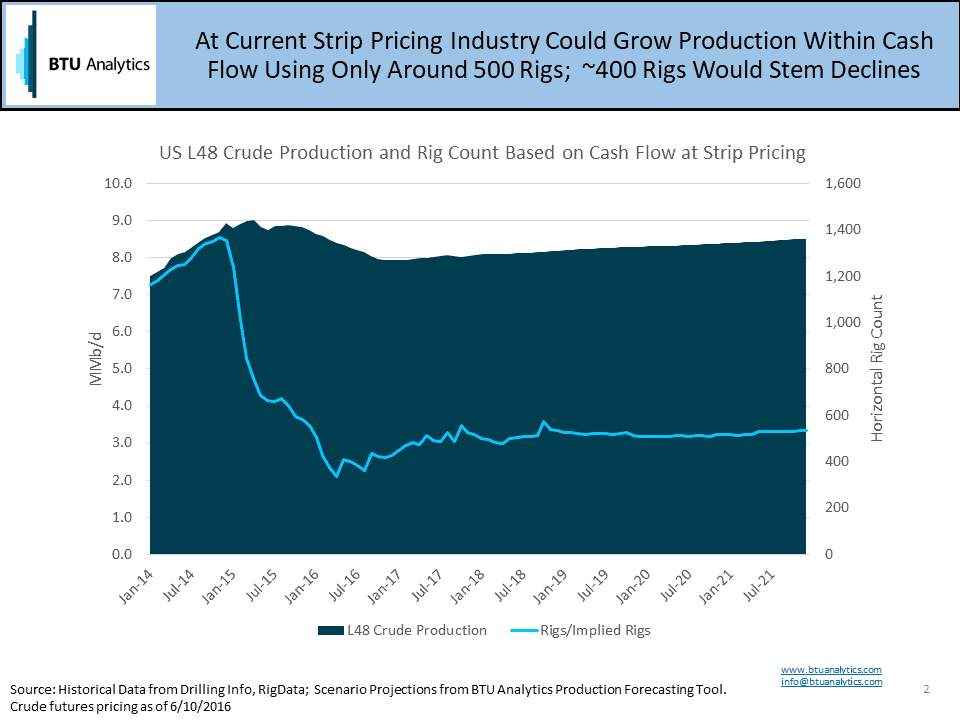
The chart above shows what is possible within industry cash flow at the current strip. We focus on cash flow because the influence of outside capital through the debt or equity markets waxes and wanes depending on the industry’s attractiveness to the investment community. The production scenario in the chart above does consider the capital efficiency producers are getting from drilled but uncompleted wells (DUCs) across the US. This scenario implies that current strip pricing could provide the necessary capital to bring back 100-200 rigs over the next five years, reversing US L48 crude oil production declines and returning the industry to growth.
Note that we used the word ‘could’. The output from the model shown above doesn’t consider cash leakage for debt repayment, corporate overhead or dividend payments to investors. Stay tuned to BTU Analytics’ Energy Market Commentary for more data and insight on the factors that will impact the market’s recovery.
To learn more about BTU Analytics’ suite of tools, proprietary data and market leading analysis, click here.