


The BTU Power View brings together a cohesive analysis of the renewable and thermal generation markets including vetted capacity analysis around existing projects and projects under development, as well as asset-level forecasts of generation, creating unprecedented insight into the evolving US power markets.
The US power generation markets are as fluid and dynamic as ever as wind, solar, and battery developments now represent the majority of go forward development. Green hydrogen projects have emerged as the power market’s ‘new new thing’ and are now tracked in Power View. The BTU Power View creates a clear picture of how the power generation markets are changing. By developing a BTU Grade for each project under development, BTU has turned a disparate data set into powerful information. Federal, state, county, ISO, PUC, utility, developer, environmental filings, satellite imagery, tax filings and other data sets are collected to form our analysis. The BTU Grade leverages our proprietary data collections process and analytical algorithms combined with deep analysis by BTU’s power team resulting in maps, development stacks, and forecasted capacity and generation. The BTU Power View goes beyond just the who, what, when and where and shows the ‘why’ and ‘what it means’, providing an ideal analytical platform for project developers, corporate development, business development, portfolio managers and anyone trying to understand the dynamic power markets.
Coverage includes:
- BTU Analytics’ proprietary BTU Grade which separates the projects actively moving through the development process versus the numerous low probability development projects. See development stacks and maps that show project development by ISO, state, county, fuel, and vintage all by BTU grade
- BTU’s forecast of capacity, generation, and capacity factor, by fuel, by plant, by BTU grade out as far as 36 months
- Asset-level analysis, for both renewable and thermal plants, highlights emerging risks and development opportunities
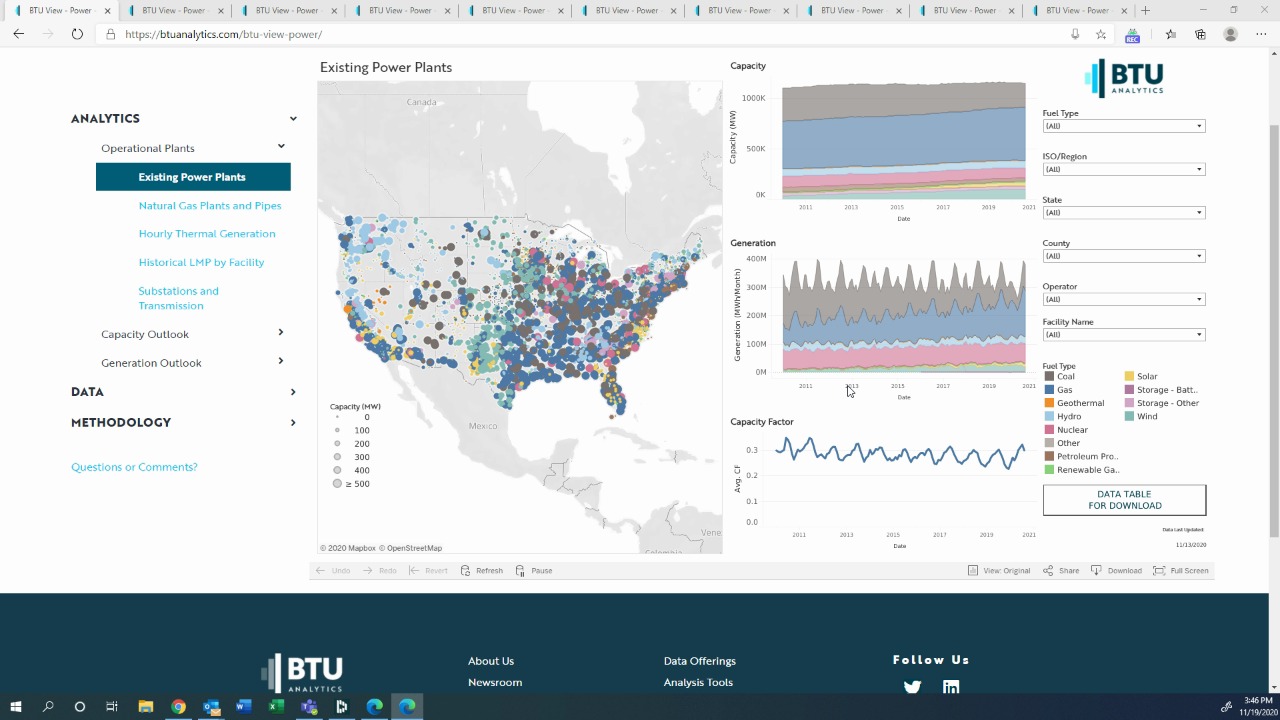
- Historical data in a map, chart, and data download of capacity, generation and capacity factor by ISO, state, county, plant and fuel type
- A quick and easy EPA CEMS data viewer and export of hourly generation and heat input data back to January 1, 2015 by unit but also easily aggregated by plant and by day. Multiple plants can be selected for a single simple bulk download of a portfolio of plants.
- Vetted retirements with retirement stacks that show retirements by ISO, state, county, fuel and vintage
