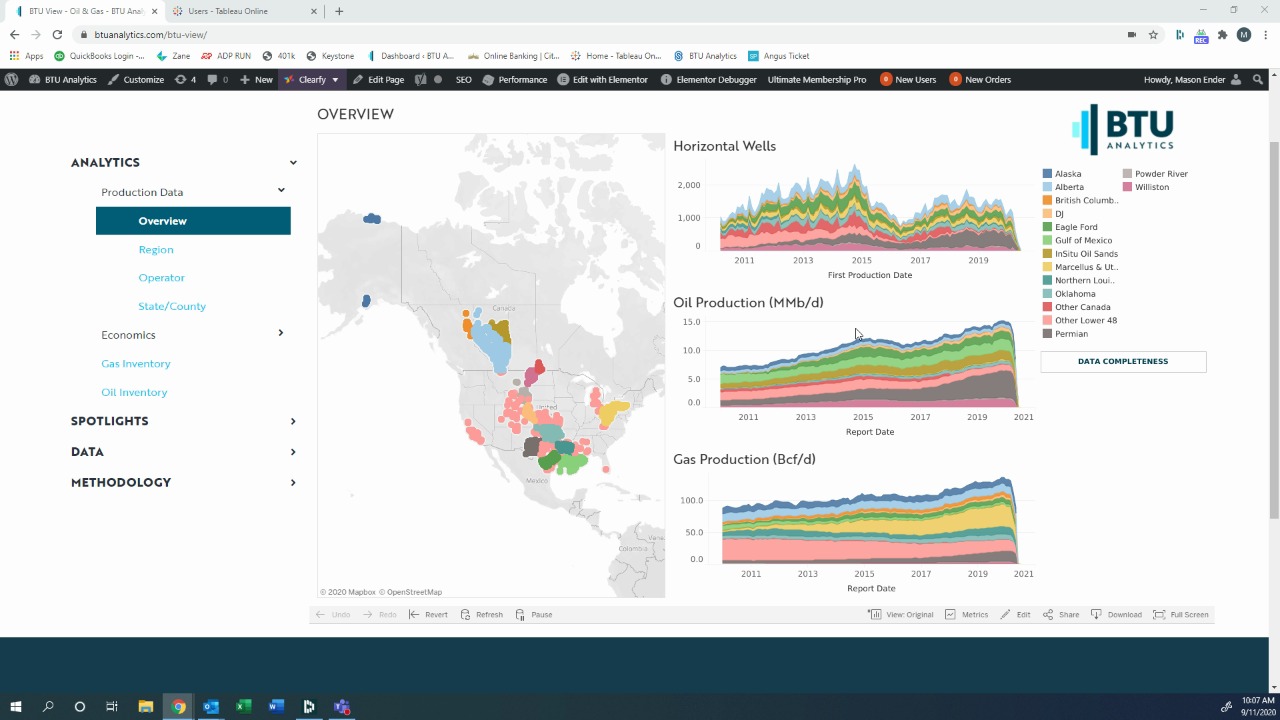
The most accurate oil and gas production forecasts start with the most accurate oil and gas production data. After years of deconstructing, reorganizing and reclassifying production data from other market data sources, BTU Analytics began collecting, cleaning, standardizing and allocating state level production data in-house to provide the raw data underlying BTU’s flagship Upstream Outlook forecasts. BTU Analytics is now making the same data available to our clients in the easy to use BTU View platform or bulk FTP download. Users can analyze production either geographically or by operator at the click of a button and download those data sets to analyze in-house. Because we work with the data every day, we know which state provided data is incomplete or inaccurate and we integrate that knowledge into the product so that our clients are using data that they can trust.
Coverage includes:
- Monthly updates of oil and gas production for the US and Canada, constituting the underlying data for all BTU production forecasts
- Access to well-level historical production as far back as 1950
- Automatically generated type curves by area, operator, formation or well vintage
- Metadata including API numbers, formations, latitude and longitude, lateral lengths, and daily flaring
- Quick “Jump To” buttons taking you deeper into the data
- Available in both an online platform and bulk FTP download