Since BTU Analytics began modeling well-level breakeven prices in 2016, it has used a 10% internal rate of return (IRR) as the benchmark return that most operators would need to continue drilling. However, that hurdle rate is changing as investors demand higher returns from publicly traded companies and pressure mounts to reduce operational emissions. As the E&P landscape has shifted, BTU Analytics decided to increase its benchmark IRR used in breakeven modeling to 20%. This analysis will focus on the driving forces behind that change and the impacts on average well breakeven prices and undrilled inventory.
Higher Cost of Capital
Weighted average cost of capital (WACC) is key to understanding the internal hurdle rates that companies must consider before investing in new production. As illustrated in the formula below, WACC utilizes the cost of equity and the cost of debt, combined with the percentage that each equity and debt make up of total capitalization, to build a weighted average for the firm. The cost of debt is simple. It is based on interest payments as a percentage of total debt and adjusted for the tax benefits provided by interest payments. The cost of equity is more involved depending on the method chosen. If the company issues a dividend, the cost of equity can be the dividend divided by the share price. While many publicly traded E&Ps have adopted a dividend in recent quarters, roughly 40% of the public E&Ps included in this analysis do not yet have a regular dividend. This means that the cost of equity must be calculated based on the volatility in the stock price in relation to the overall market (expressed as beta). Oil and gas stocks have been especially volatile in recent years due to the pandemic and resulting economic recovery, making this beta-based metric, and therefore WACC, misleading.

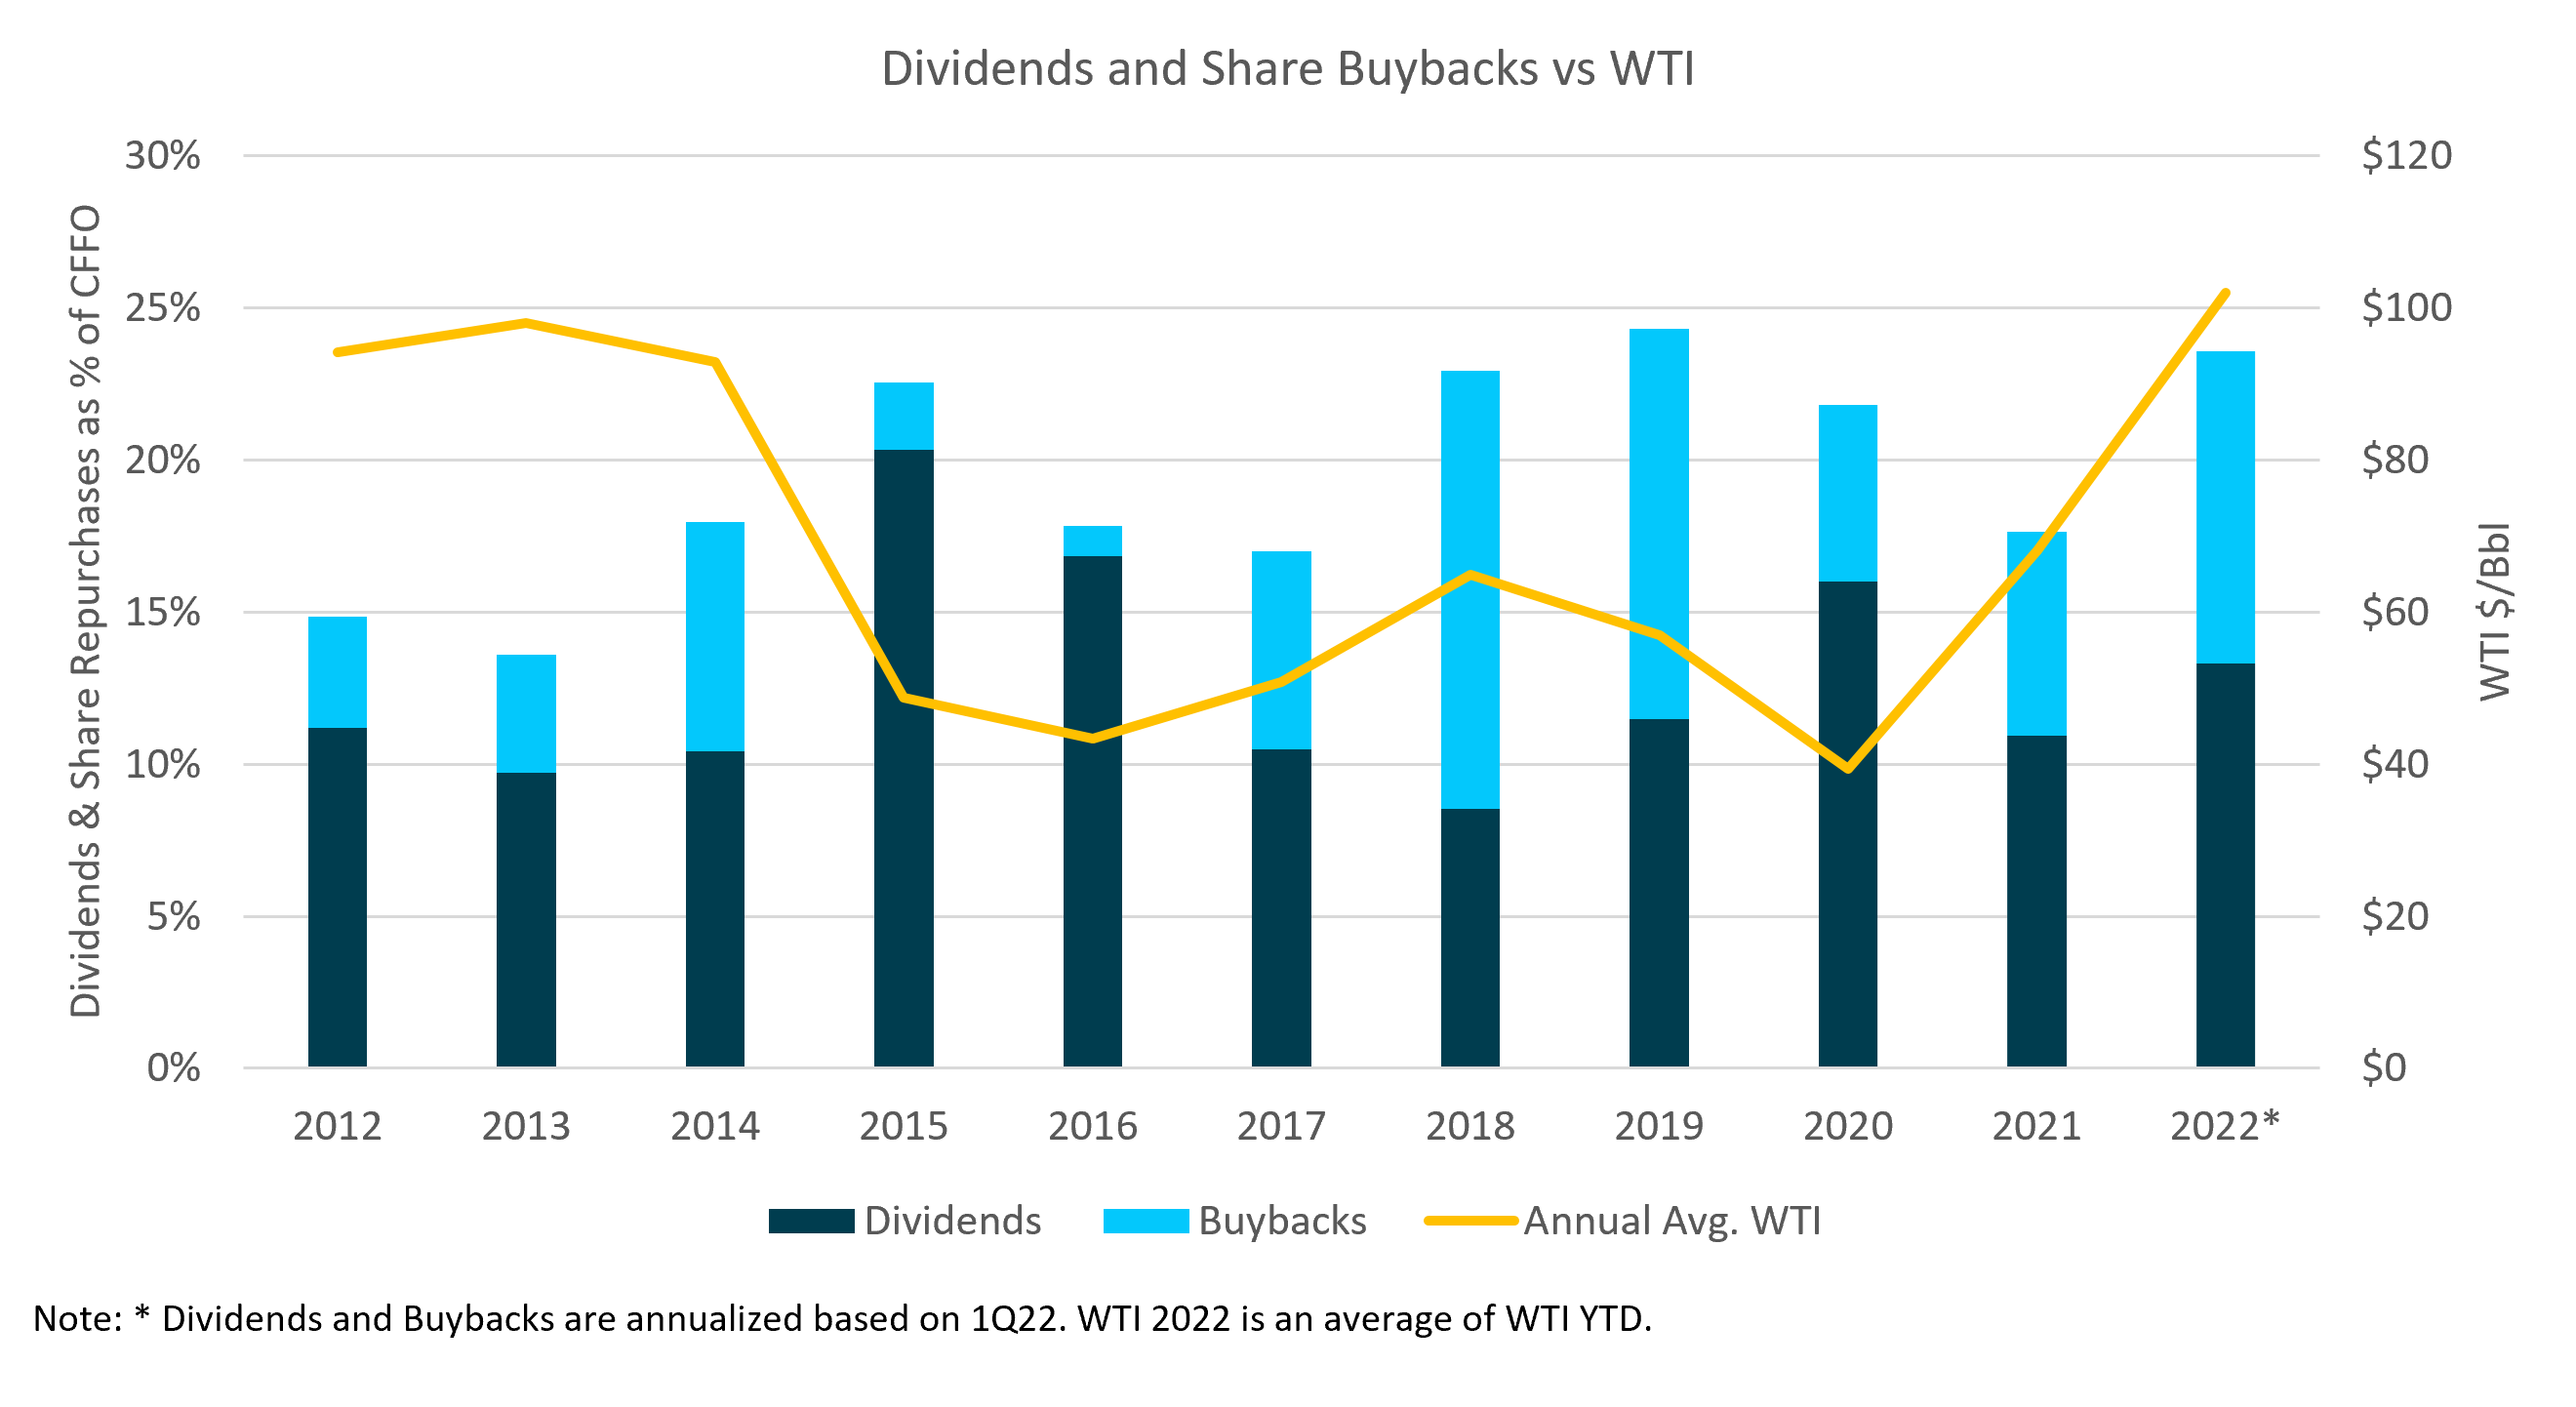
While WACC as an absolute number may not be the best way to see trends in industry hurdle rates, understanding the individual pieces that make up WACC is important. Rising interest rates are expected to contribute to a rising cost of debt as producers refinance their existing debt. Additionally, the cost of debt has historically been lower than that of equity, so as debt reduction continues among public producers, the percentage of debt to overall capitalization will shrink. This will increase the overall cost of capital as the more-expensive cost of equity is given a higher weighting. Cost of equity is also rising as public producers continue to adopt and increase dividend payments, as shown in the chart below. After annualizing 1Q22 financial data, 2022 dividend payments are almost double what they were in 2013, when pricing was similar. When adjusting for the rise in cash flow from operations since 2013, 2022 shareholder returns are roughly near the highs of the last decade. This is important considering that most producers have only reported one quarter this year. As pricing remains elevated in 2022, BTU Analytics expects that dividend payments will continue to rise throughout the year.
This chart above only accounts for the changes in public operators’ capital structure, and not all operators will act the same. In fact, many privately held producers may still have a lower cost of capital, given that some private equity investors may accept a lower cost of equity to encourage a faster drilling pace. This in turn can help accelerate the private equity group’s eventual exit from the investment. Similarly, privately owned operators have fewer investor pressures than their publicly held counterparts, as evidenced by the rising public market emphasis on emissions reduction. Nevertheless, BTU Analytics views that these producers should be viewed on equal footing.
Impact to Economics and Remaining Inventory
Raising the IRR from 10% to 20% results in higher breakeven prices, which BTU Analytics believes better reflects these changing market sentiments and expectations. However, the impact is not uniform across plays or across breakeven bands. The charts below summarize for oil plays and gas plays the shift in breakeven prices. Raising the hurdle rate disproportionately impacts the lowest and highest breakeven bands. This is not a surprising result, as inventory would be expected to shift to higher breakeven bands across the board.
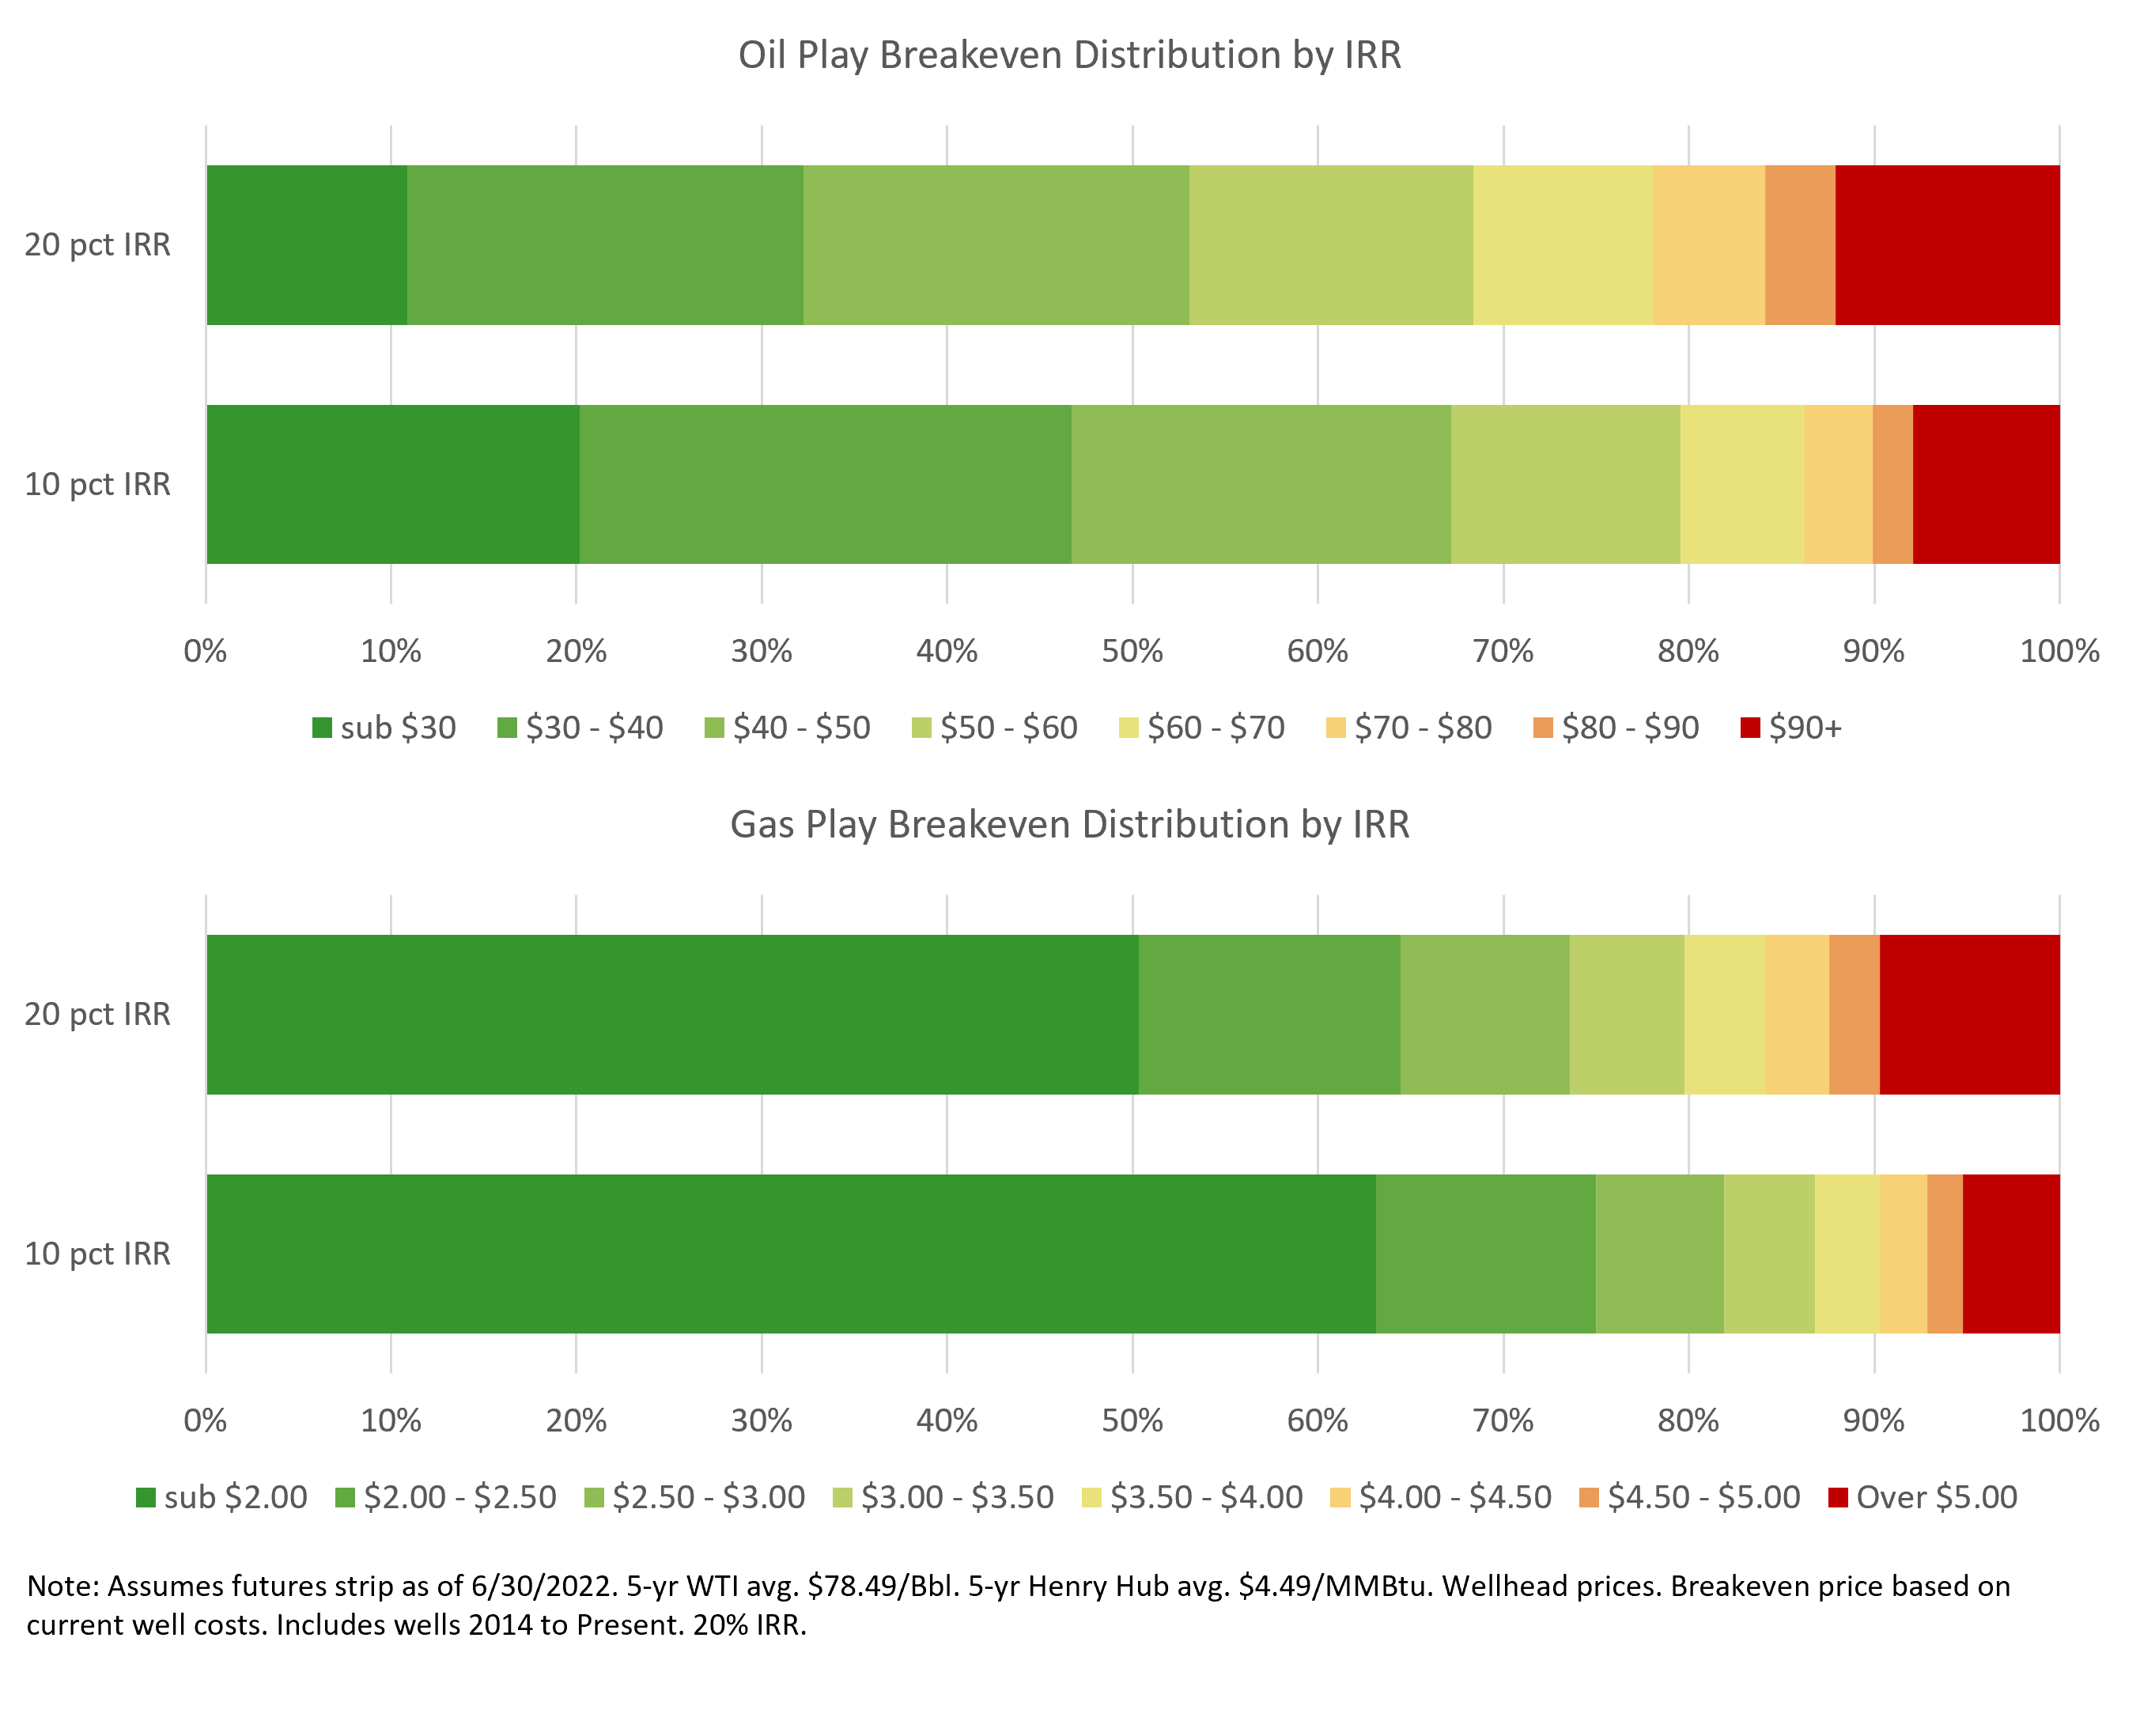
In aggregate, the number of wells that breakeven at a sub-$30 price point decreased by 46%, and the number of wells in the adjacent grouping with a $30-$40 breakeven price decreased by 19% across the major oil plays (Williston, DJ, PRB, Eagle Ford, and Permian). For the gas plays (Fayetteville, Haynesville/Cotton Valley, SW Appalachia, and NE Appalachia), the number of wells with a sub $2.00 breakeven price decreased by 20%, while wells in the next group up, with a $2.00-$2.50 breakeven, nearly offset the sub $2.00 decrease and rose 19%.
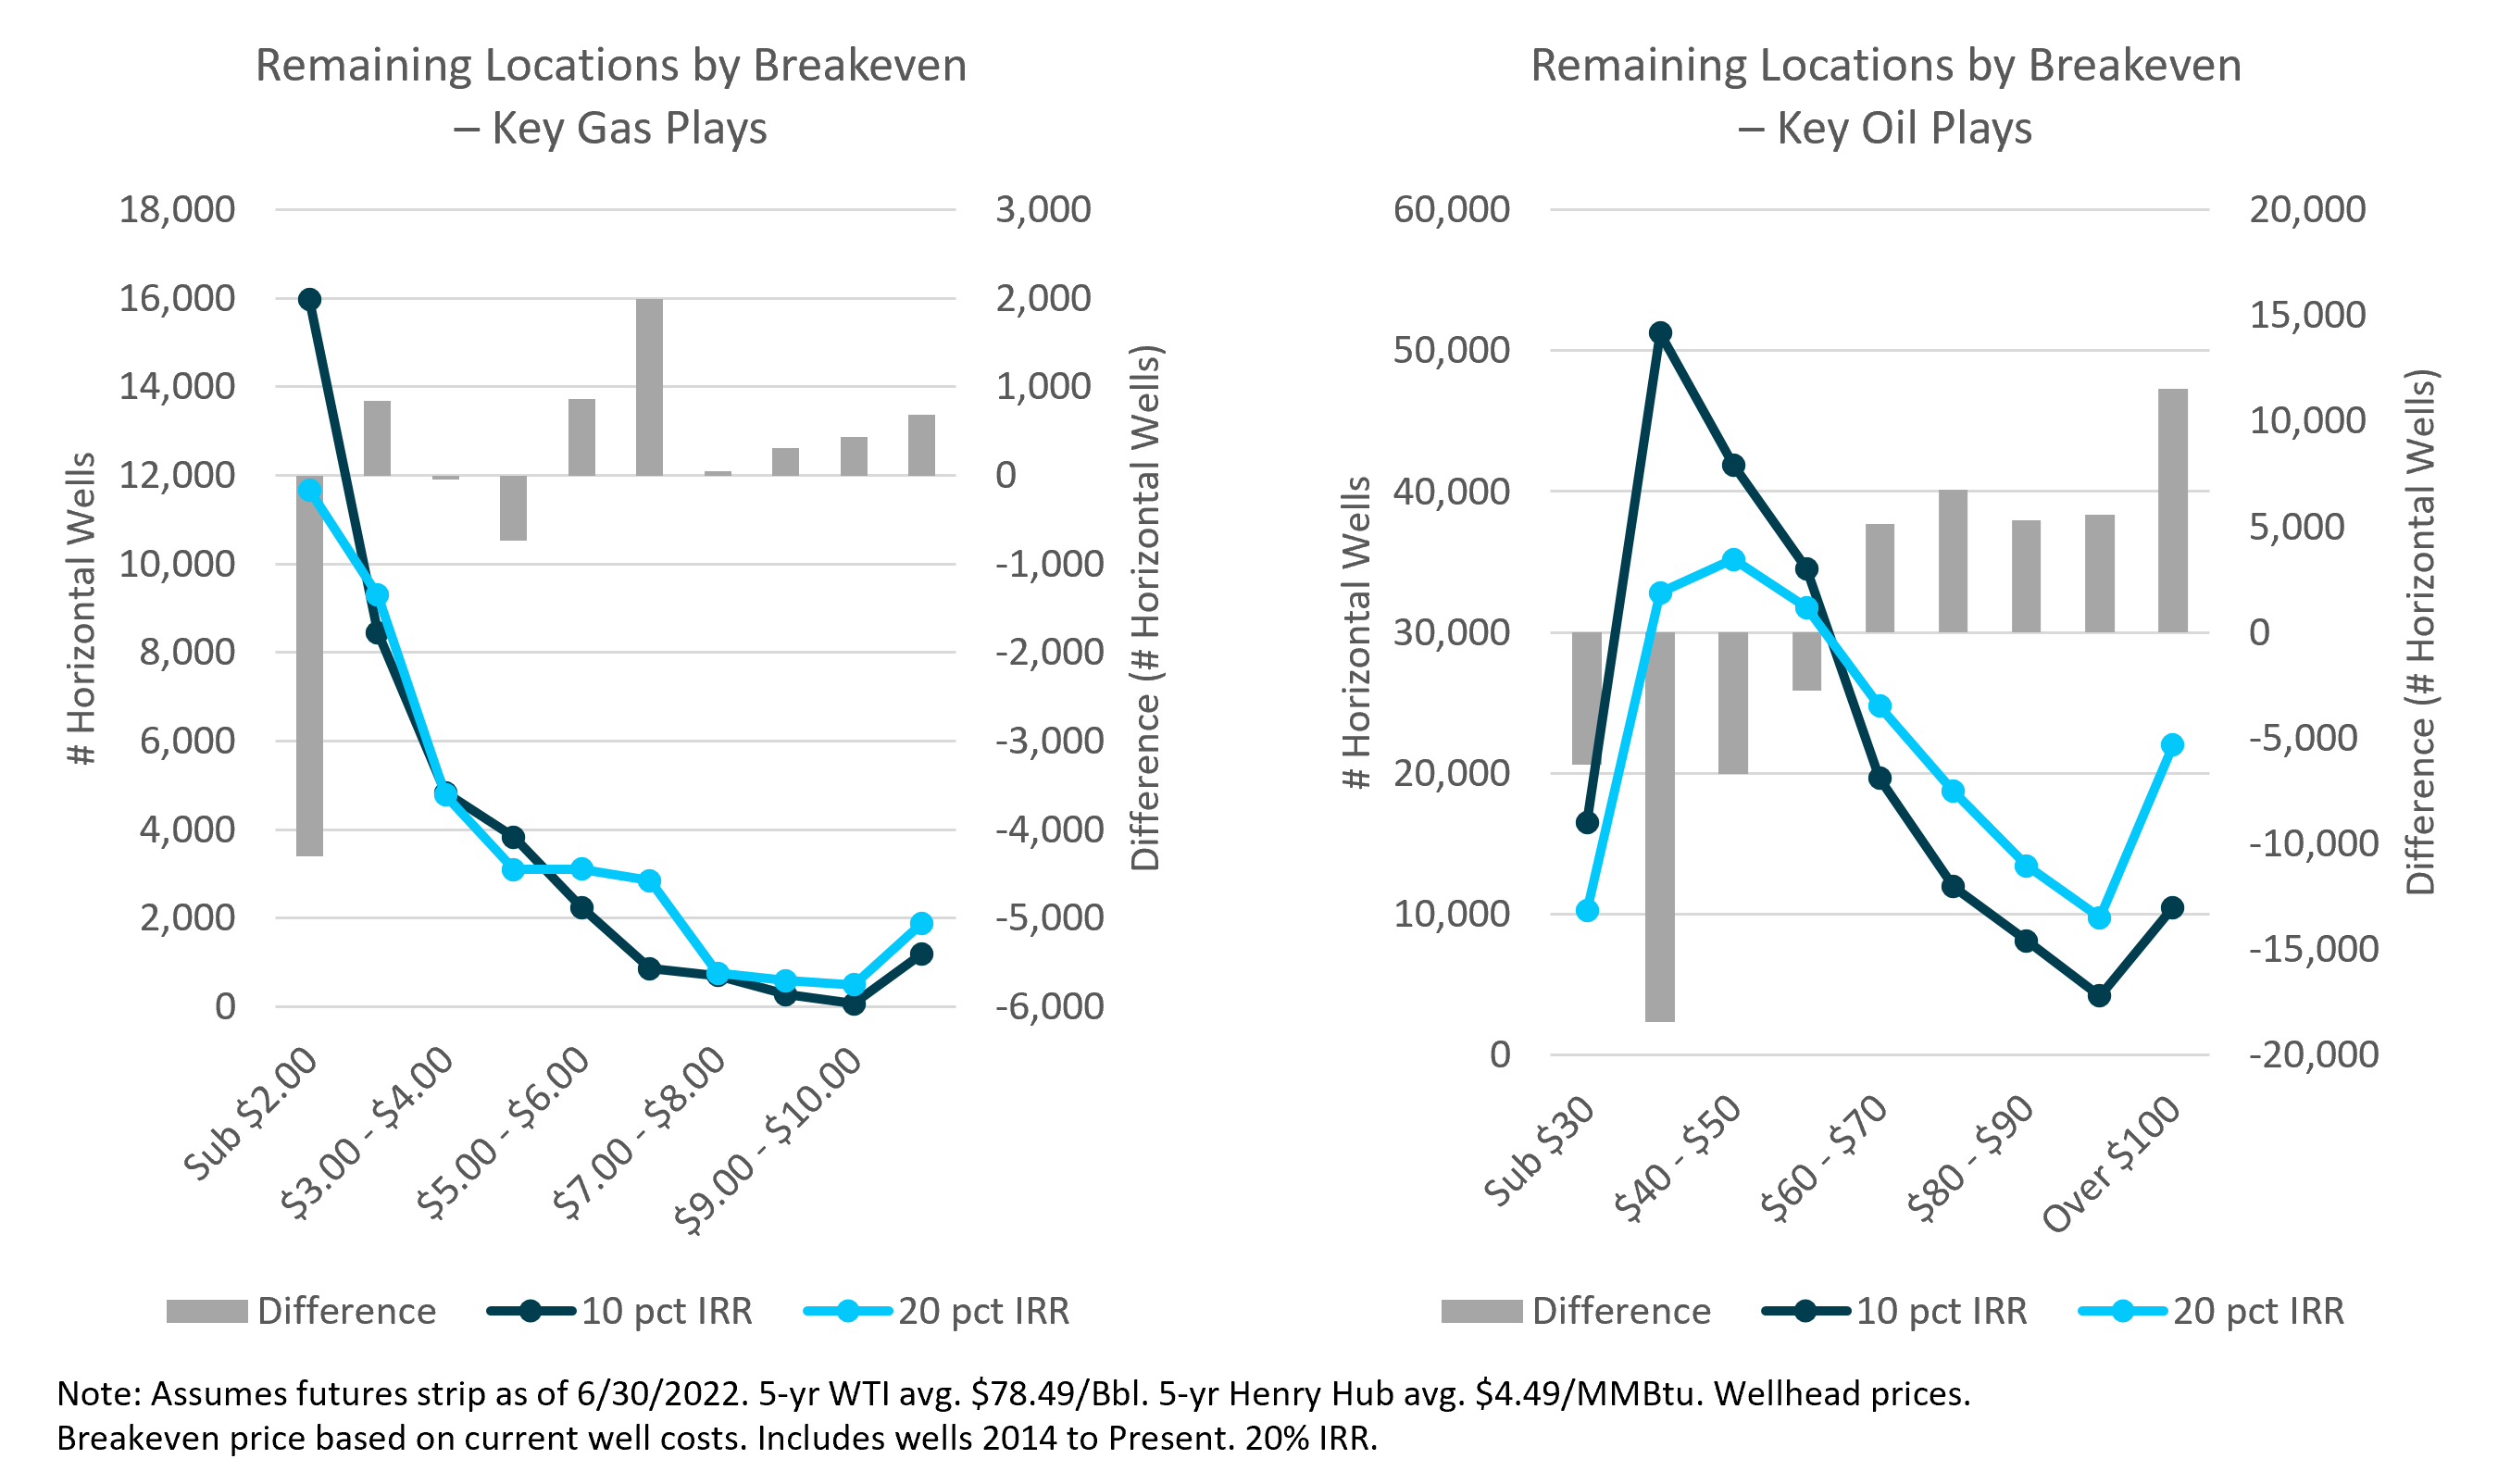
These shifts in well-level breakeven price will ultimately translate into a shift in the distribution of the breakeven price of remaining drilling locations but not the total number of remaining locations. As highlighted in the charts below, the impact is disproportionately felt in the sub $2.00/MMBtu inventory bucket for gas plays, whereas for oil, the largest impact was to the $40-$50/Bbl group.
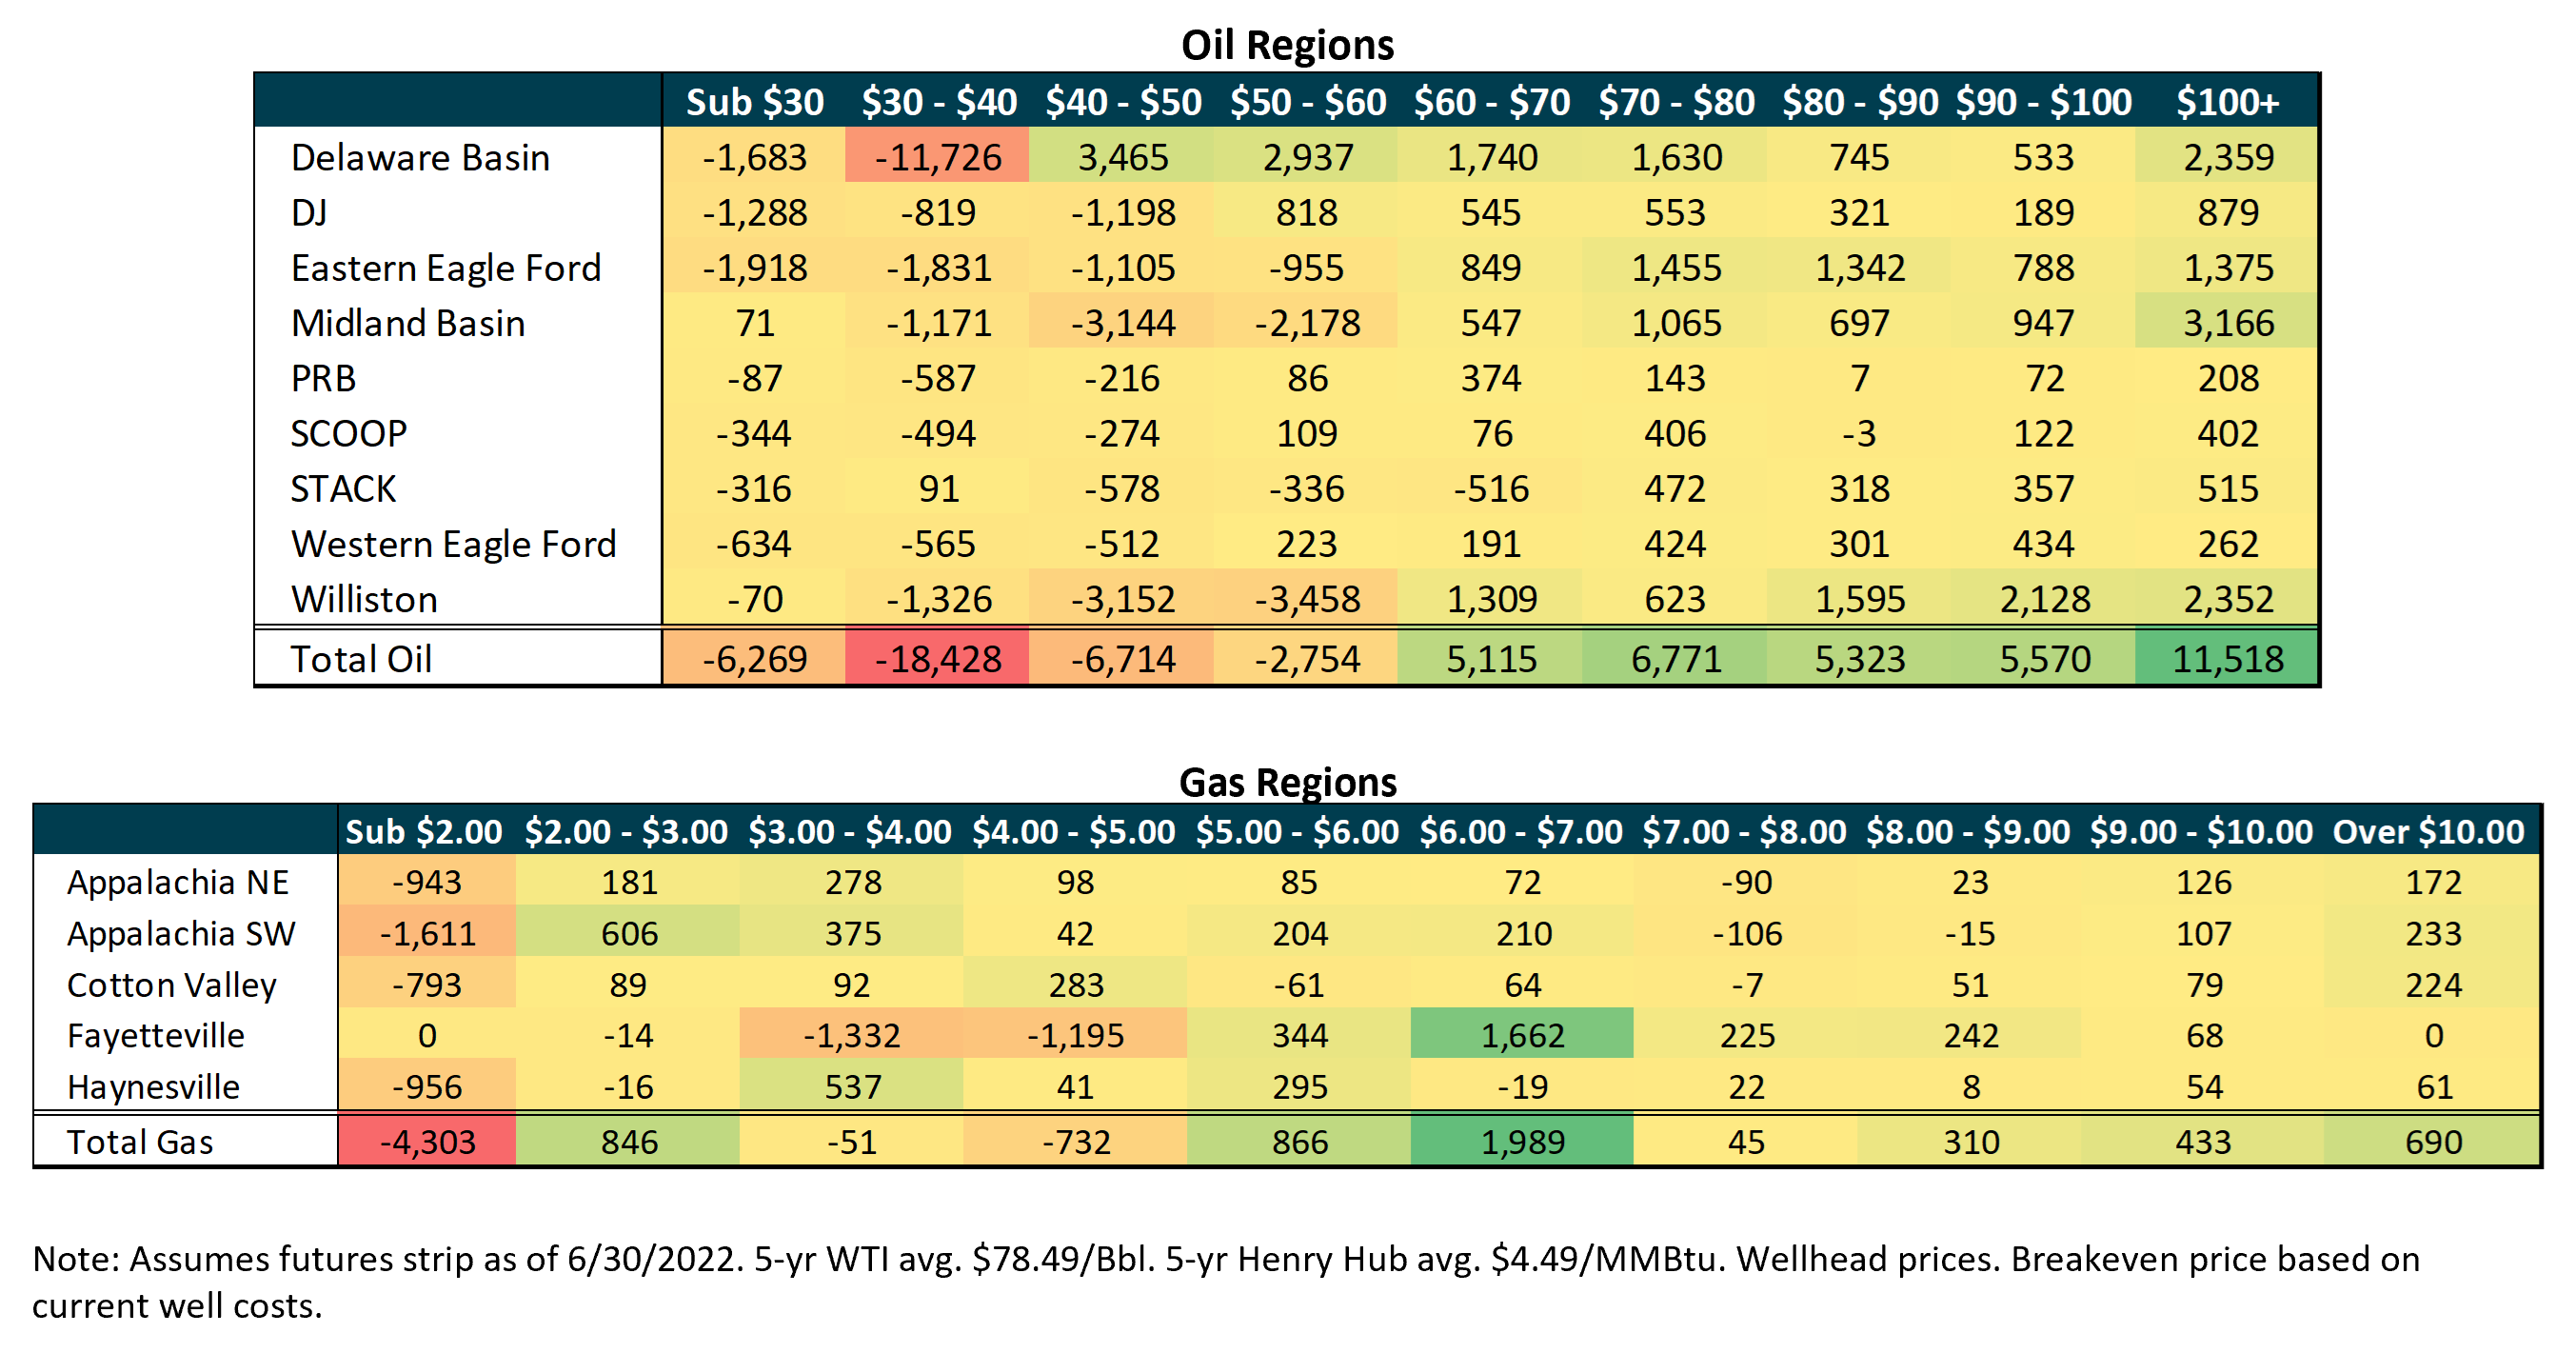
Dissecting these trends in more detail in the tables below helps highlight the implications for the longevity of investment, activity, and the marginal price of production for the key regions.
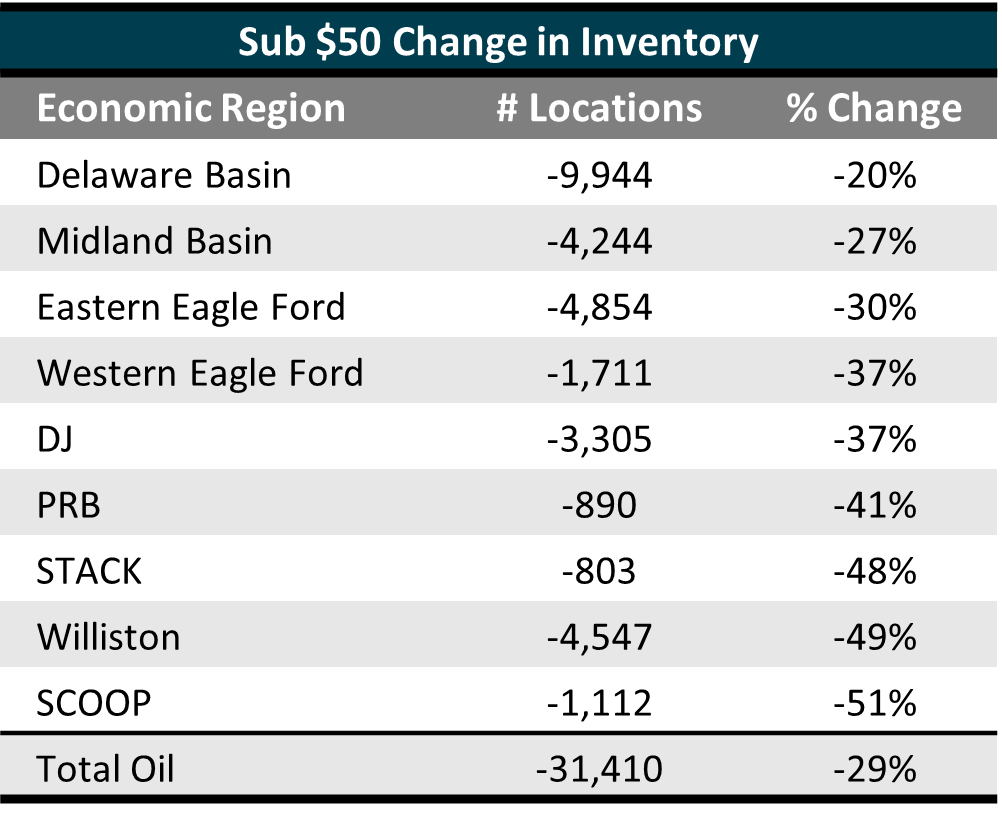
Across the oil plays and focusing on premier sub $50 inventory, in terms of the outright number of locations, the Delaware Basin showed the largest decrease of just under 10,000 locations. However, the Delaware Basin has multiple, highly productive horizons and therefore, on a percentage basis, only lost 20% of the sub $50 locations. Comparatively, on a percentage basis, the STACK, SCOOP, and Williston Basin all lost about 50% of premier sub $50 remaining drilling locations. As the oldest horizontally developed oil play, this loss in sub $50 remaining locations in the Williston is significant in that the Williston already had a shorter runway of top-tier acreage than areas like the Permian. While prices are high, this shift in inventory may not be material to how operators invest in the basin but in a lower price environment. This shift highlights the concern for long term development if capital costs remain elevated.
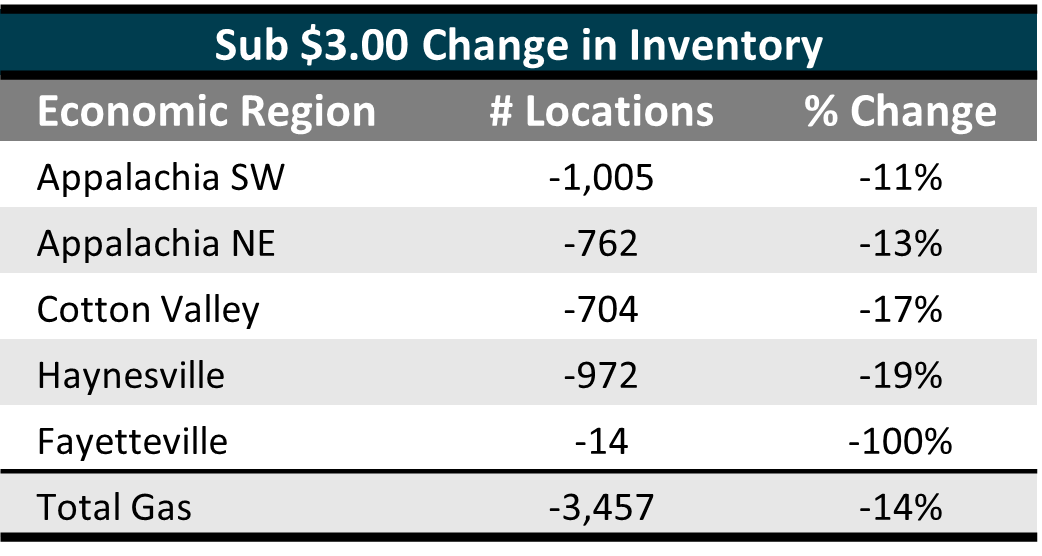
For gas plays, SW Appalachia saw the largest outright change in sub $3.00 inventory. However, pipeline takeaway constraints are expected to temper incremental activity above current levels, which will help preserve low-cost inventory across Appalachia. However, in the Haynesville and Cotton Valley formations, the decrease in the number of locations remaining at sub $3.00 is important. As highlighted in BTU Analytics’ June 2022 | Upstream Outlook report, the call on gas from the Haynesville region is expected to increase to support growing US LNG demand over the next decade. The pace of drilling required to support BTU Analytics’ current LNG growth outlook would lead to the depletion of sub-$3.00 by 2030 under the new 20% IRR rather than the mid-2030s under a 10% IRR.
If US public producers continue to prioritize shareholder returns and funnel cash away from development, then the era of low commodity prices in the US has likely come to an end. As highlighted by the above analysis, rising capital costs for US E&Ps will lead to a higher breakeven development price for US natural gas and oil.
Supplemental Tables
Changes in # Remaining Locations by BTU Economic Regions