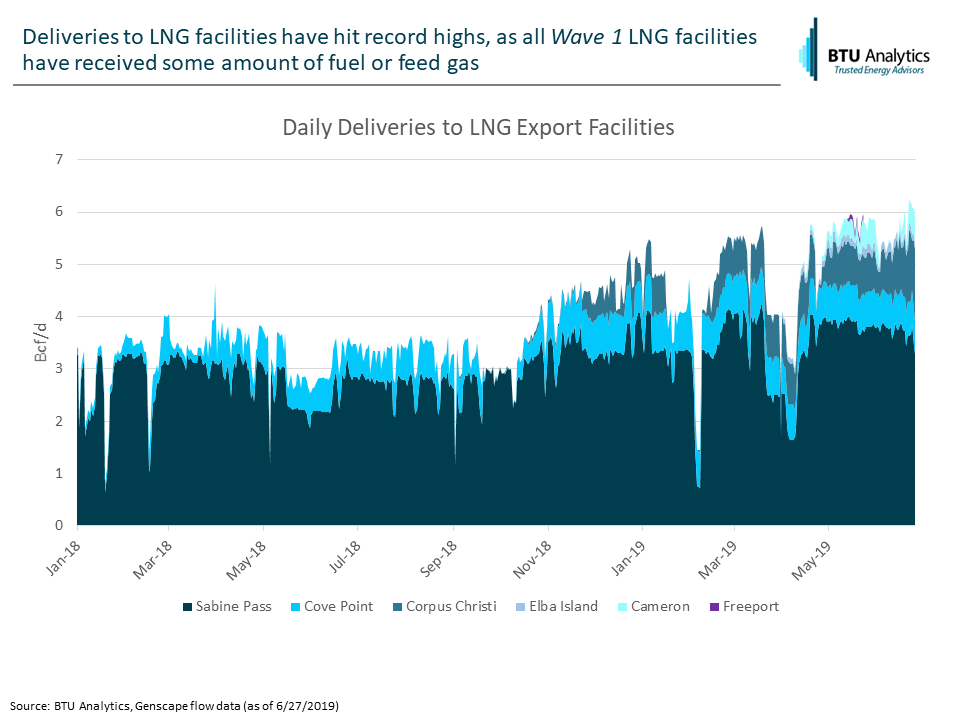
Once again US LNG exports have reached new highs. At this point all Wave 1 facilities have seen some amount of natural gas deliveries to their terminals, pushing total US LNG gas demand to just over 6 Bcf/d. That’s up 2.5 Bcf/d year-over-year, no doubt a strong showing, yet Henry Hub prices (spot and futures) languished. Cash prices have struggled, not breaking above $2.40 since the beginning of June, while the remaining strip this summer is sitting at only $2.28/MMBTU. However, continual LNG export delays have no doubt contributed to the downward stranglehold on prices.
Firstly, LNG feedstock demand has surged. The graphic below shows deliveries to all US Wave 1 facilities, surging beyond 6 Bcf/d in recent days.
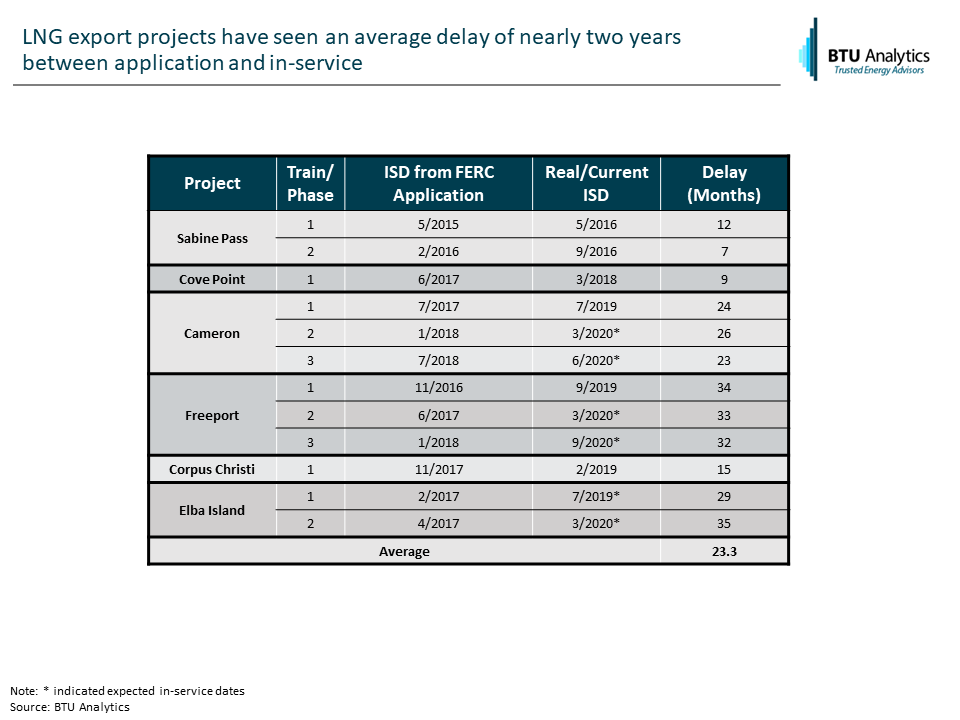
However, let’s take a step back from the record breaking and look at what could have been. Looking at announced in-service dates from just last year, show we should have had an additional 3 Bcf/d of capacity online this summer, but facilities such as Cameron, Freeport, and Elba Island have delayed multiple times. If not for these delays I would be writing about LNG deliveries nearing 8 Bcf/d, however, that conversation will have to wait till 2020 now.

While delays for Wave 1 facilities have become the norm, what could this mean for Wave 2 facilities? Currently, there are a number of facilities that have proposed in-service dates in 2023 and 2024. Having new facilities come online within the next 5 years would go a long way towards closing the LNG gap between Wave 1 and Wave 2 facilities. However taking history as our guide, those in-service dates are likely to be pushed back by as much as two years.
The table below outlines in-service dates for Wave 1 projects as stated in their initial FERC application and what their real in-service was or what their currently announced in-service is. Some Wave 1 facilities are omitted if their timing was not explicitly laid out in their application. For the included facilities, LNG export delays averaged 23.3 months from proposed in-service date to the currently expected in-service date.
All of this doesn’t mean to say we will not see Wave 2 facilities come to market, it just means we might have to wait a little longer to see that demand hit the market. What happens in the meantime though? With all Wave 1 LNG trains expected to be online by 2021 to 2022 and Wave 2 facilities probably not hitting the market until 2025+, what does that mean for the market in the intervening years? To see how other forms of demand will step up or supply will react, see our latest edition of the Henry Hub Outlook for BTU’s five-year view on natural gas supply, demand, and pricing. Interested in what happens after the next 5 years? Our Long Term Gas Outlook can tell you what will drive pricing five years and beyond.