The LNG export revolution continues with the start of feed gas deliveries to Kinder Morgan’s Elba Island LNG, the smallest facility expected to begin operations in 2019. Elba Island LNG will only have capacity of about 350 MMcf/d following the completion of Phase 2. However, the start of Elba Island LNG does represent a shift in facility design away from large, high-capacity trains, to smaller, more flexible liquefaction capacity.
Previously, US LNG export facilities have consisted of multiple trains with capacities between 600 to 700 MMcf/d. Each additional train, then adds significant new demand. The chart below highlights the ramp in US LNG exports. Feedgas deliveries to export facilities went from representing 1% of total US natural gas demand in 2016 to an expected 7% in 2019.
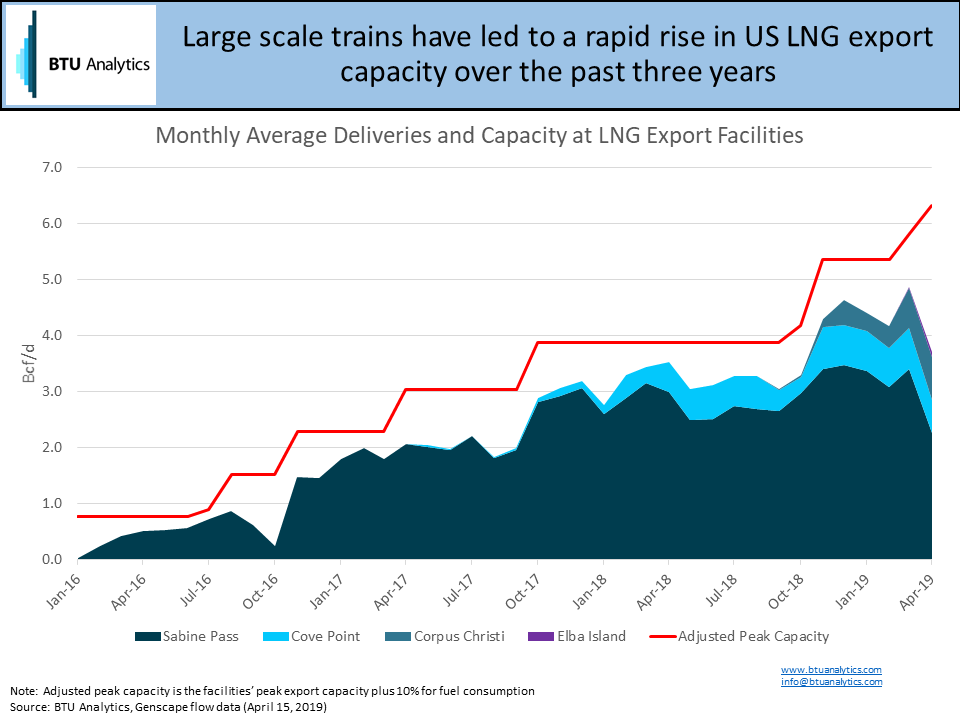
Two more Wave 1 facilities are expected to begin commissioning relatively soon: Freeport LNG and Cameron LNG. Both of these facilities will consist of three trains. Each train will have a capacity of about 600 – 650 MMcf/d. As a result, the export capacity from the US will continue rising steeply as these facilities come online.
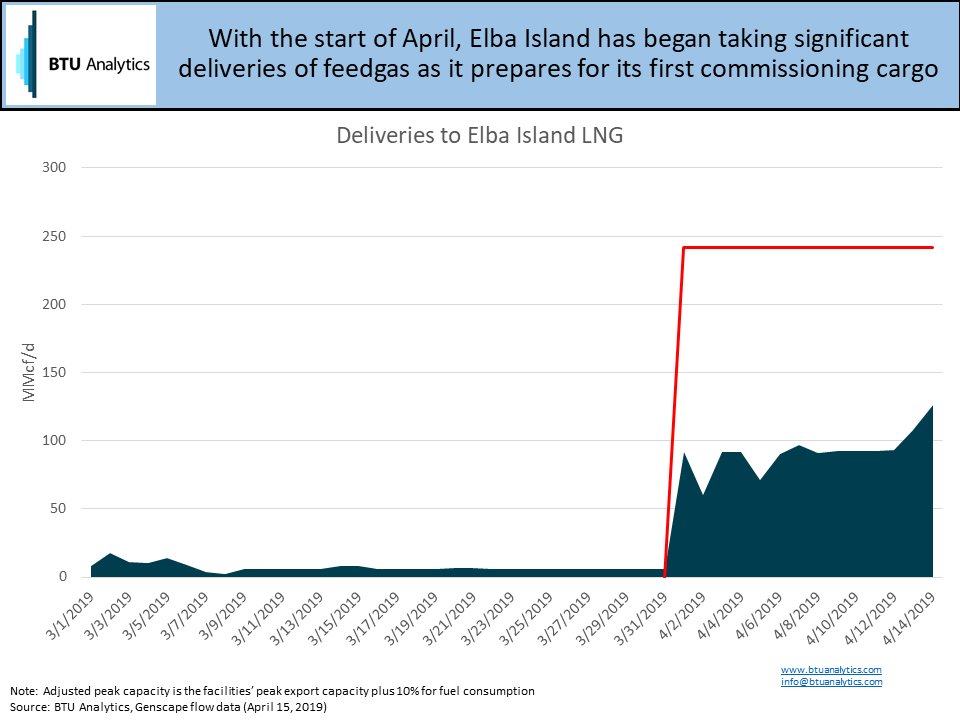
However, barely even noticeable on the tail-end of that graphic is a purple sliver that represents deliveries to Elba Island. The graphic below zooms in on Elba’s portion of the above graphic. The facility began to ramp up in March 2019 initially taking fuel gas to power the facility. In April, the facility began taking feed gas to be liquefied for export or utilized in LNG bunkering.
One aspect that separates Elba Island from other Wave 1 facilities is not only its smaller total capacity but its use of Moveable Modular Liquefaction System (MMLS). Instead of building one large train with a capacity of 350 MMcf/d, Kinder Morgan plans 10 smaller trains.
Not only are Kinder Morgan and Elba Island using this strategy, but many Wave 2 facilities as well. Currently, there are approximately 90 proposed Wave 2 trains, with a total capacity of about 31 Bcf/d. Of those 90 trains, however, 48 have capacities of 200 MMcf/d or less. Smaller capacities translate to smaller sales contracts. Smaller sales contracts may lower the hurdle to making a positive final investment decision (FID).
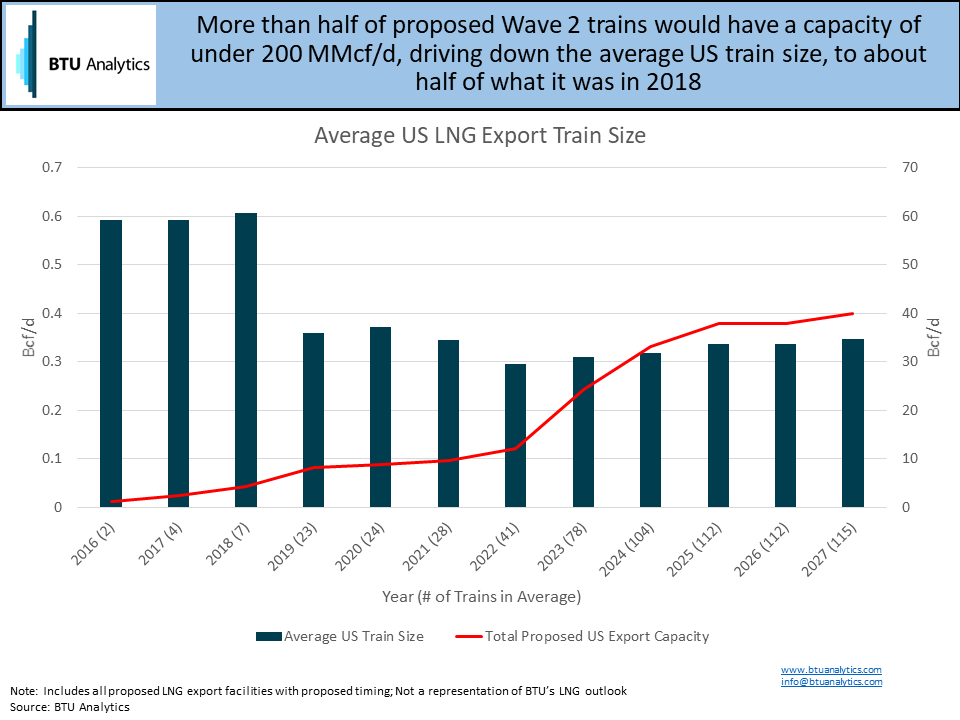
The above graphic looks at all proposed Wave 2 facilities still in some form of planning. Note, BTU does not expect all these facilities will be developed. Currently, three Wave 2 projects have made FID or signaled a positive FID in the near future. Calcasieu Pass will develop their facility utilizing 9 smaller trains. Golden Pass and Lake Charles will develop more traditional large-scale trains for their facilities. As the year unfolds, we will see how the rest of Wave 2 FIDs shake out. Small scale facilities like Eagle LNG in Jacksonville, FL and Texas LNG in Brownsville seem to be making forward progress, however, time will tell how many and which facilities make positive FID. BTU tracks and forecasts LNG facilities and feedgas demand in our Henry Hub Outlook, request a sample here or call us up to discuss any of our outlooks further.