Those familiar with the California energy markets have likely heard the term “Duck Curve”. In fact, BTU Analytics has written about it back in 2015 as well as more recently in other parts of the country. For the uninitiated, the duck curve describes the shape of the net load curve (demand that needs to be met outside of renewable sources) that can be seen in California. This happens because California has a significant amount of solar generation in the state. Solar generation causes net load to drop significantly during the day and then net load rapidly rises in the evening when the sun goes down and solar generation declines, creating a curve which resembles a duck. Due to rapidly changing net load, there either needs to be a large increase in energy storage to offset declining generation or power markets will see an increased reliance on quick-fired natural gas or diesel generators. California recently announced the addition of 180 MW of these units to help balance energy needs. Much like California, Florida has recently seen a rapid buildout of solar capacity and has retired much of its coal fired fleet in favor of natural gas. Today’s energy market insight will focus on how close Florida is to experiencing duck curves of their own.
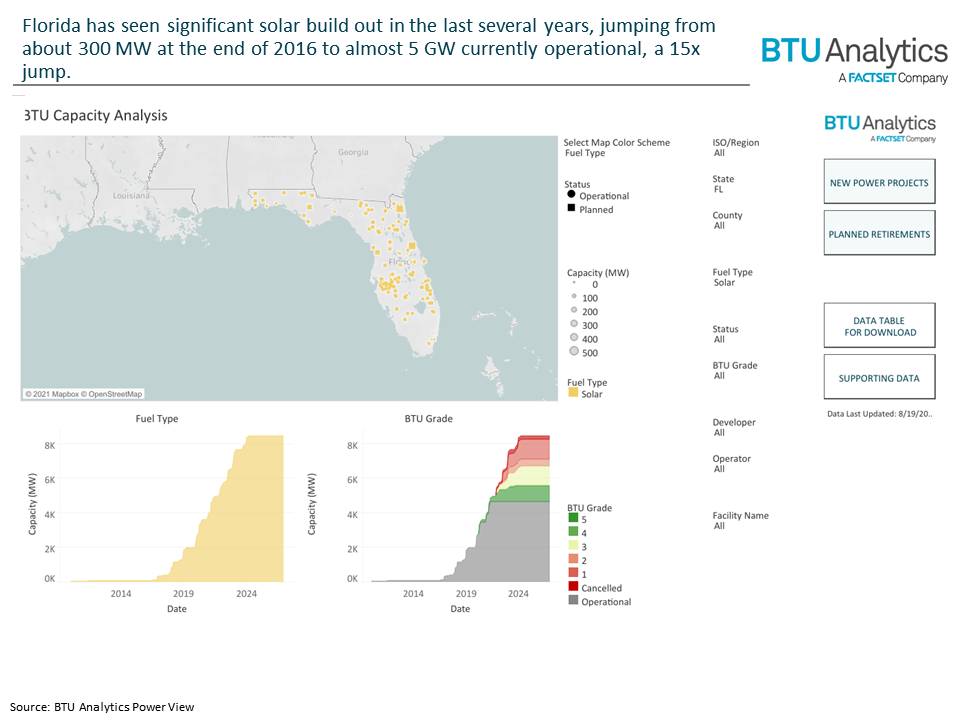
With an official nickname of the sunshine state, it should come as no surprise that Florida has seen significant increases in solar buildout in recent years. Since the beginning of 2017, Florida solar capacity has increase nearly 1,666%, from around 0.3 GW in 2017 to 5 GW presently. Additionally, 4 GW of solar capacity are in progress in Florida in various stages of development as highlighted by the BTU Grade in the chart below. Projects with a 1-2 grade are earlier in development compared to projects with grades 3-5 that have advanced through the regulatory progress and in the case of Grade 5 are under construction or near to construction.
In addition to the 4 GW of projects receiving a grade 1-5, there are additional speculative projects in the generation queues for Florida that could ultimately come to market. In all, there is a total of 17.5 GW of solar in the generation queue. With the additional planned solar capacity comes a change in the shape of the net load curve. Below is a comparison of average Florida summer load, compared to net load at various levels of solar buildout.
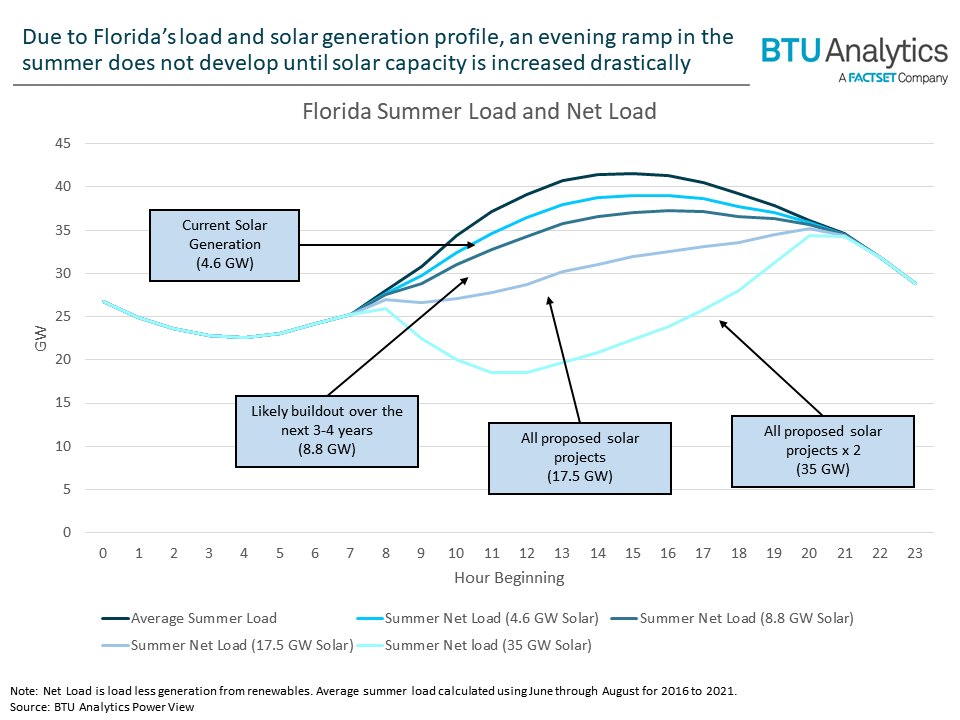
The light blue line corresponding to a solar capacity of 35GW in Florida is the closest thing to the duck curve that can be observed here. Net load (met with gas, nuclear, and coal generation) starts to drop during the middle of the day as solar generation begins to ramp up, and then quickly rises again as the sun starts to go down. However, at current levels of solar capacity (around 4.8 GW), there is not much of a duck curve, and in fact the net load curve begins to flatten slightly.
For now, incremental solar capacity in Florida flattens the net load curve, meaning less value for energy storage and quick-fire gas generators, at least until significant amounts of solar capacity come online. Does this mean that there is little value in energy storage in Florida unless large growth of solar capacity continues? No, because the story is very different during the winter in the state. Stay tuned to see the second part to this commentary, and in the meantime be sure to check out the BTU Power View to get more insights into power capacity buildouts in the coming years.