Over the past couple of weeks, a cold snap sent power prices through the roof across most of the US. During that time, Texas (ERCOT) was the hardest hit, and the debate between renewables and thermal generation began. BTU Analytics showed the truth was less black and white, and both generation sources played their role in what was a perfect storm in Texas. The cold snap and subsequent price spikes raise questions around how renewables affect pricing throughout the rest of the country, particularly in instances where wind turbines are not generating due to either the wind not blowing or being down for maintenance. So how has wind generation in a region that has seen strong wind capacity growth, such as the Southwest Power Pool (SPP), affected pricing over time?
Using the BTU Power View, we can see the rapid growth in wind capacity and generation in SPP South (which includes generation in KS, MO, TX, and OK), which is all the more important given the relatively flat load profile during the same time frame.
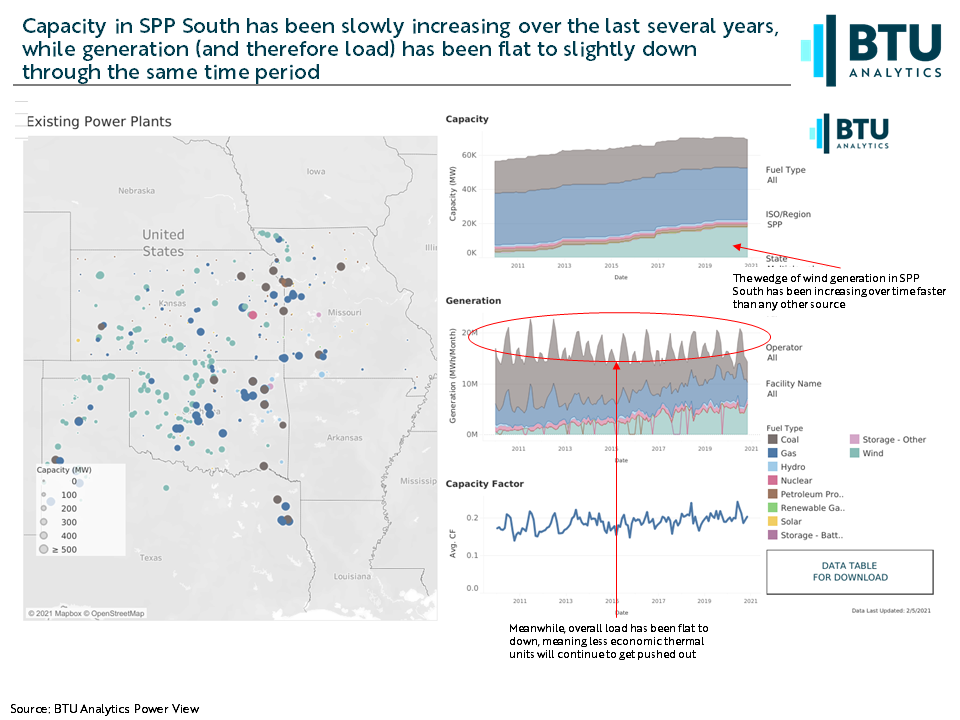
Since 2015, wind capacity has jumped from roughly 7 GW to around 17 GW in SPP South. Given a flat load profile, the effect on average pricing has been fairly predictable; it’s been trending down. However, a second, less obvious effect has been an increase in volatility.
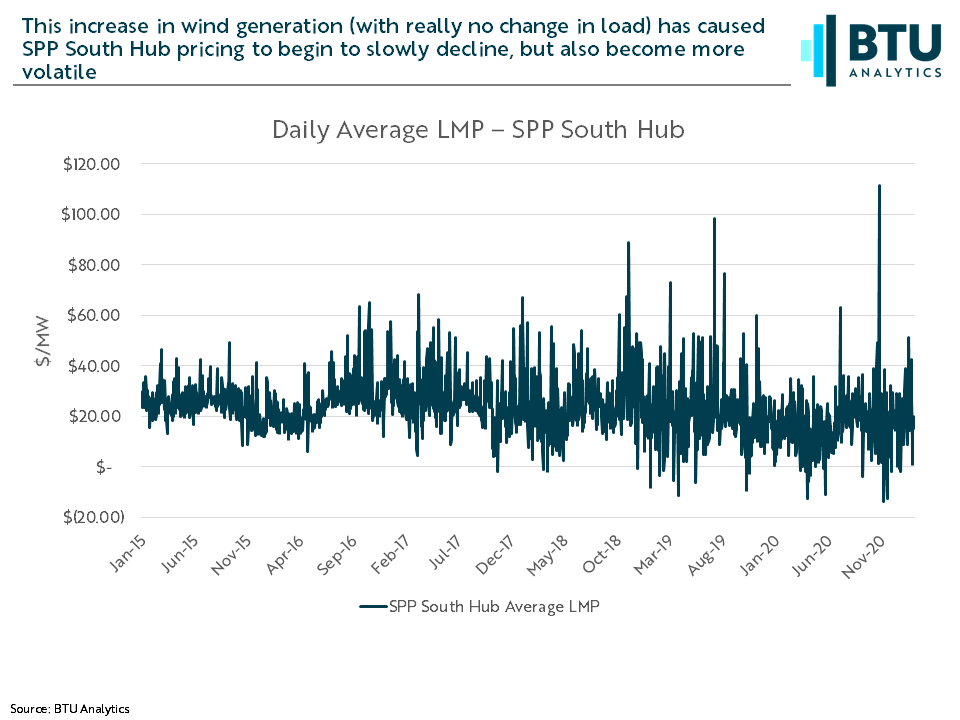
The increase in volatility is easier to see in the above chart, as the spikes (both high and low) are becoming increasingly pronounced. In 2015 and 2016, there were no days where the average price for the day was at or below $0, however, in 2020 there were 15 days (a modest increase, but still representative of a little over 4% of days for the year). On top of that, in 2015 the range of daily average prices was a minimum of $8.33/MW and a maximum of $49.17/MW. In 2020, those numbers were even further apart, at -$13.94/MW and $111.44/MW respectively.
Looking forward to SPP South, there is a significant amount of wind generation in the queue. However, much of that is at high risk of being completed as shown by the BTU Grade in the graphics at the bottom, where low graded projects are riskier than projects with a higher grade.
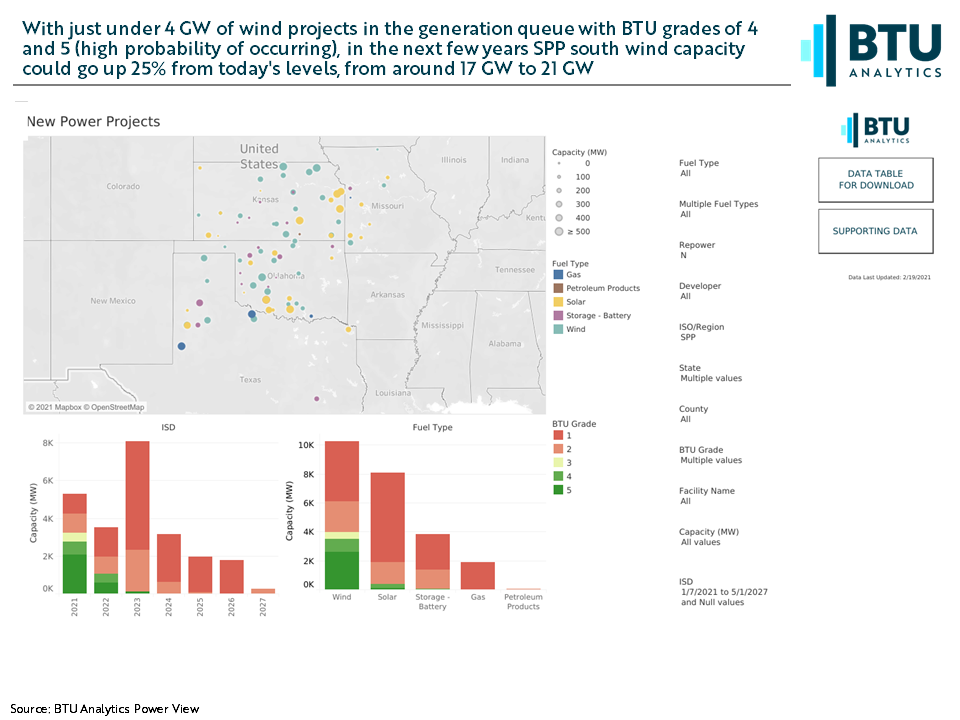
With roughly 5 GW of additional capacity that is likely to come to market over the next few years, we could see even lower lows when the wind is blowing, and higher highs when that generation cuts out as nearly 2GW of thermal generation is set to retire over the next 3 years. The addition of this much wind (which is obviously even more volatile than solar generation) begins to highlight how important storage will start to become in helping to control the volatility of pricing. These pricing effects will likely be seen in other ISOs as intermittent renewable technology development continues to be a focus.
To see more on existing and planned capacity, as well as retirements and much more, be sure to check out the BTU Power View.