The US E&P market is unlike any other in the world. Vast resources are able to be tapped by thousands of producers, from mom and pop’s to majors, and capital is able to flow freely to companies with the best prospects due to our efficient capital markets and sophisticated financial industry. But not all companies will be able to thrive in the current market environment.
BTU Analytics’ E&P Positioning Report is a powerful tool that provides comparisons of US operators on an even playing field, allowing readers to cut through the mountains of data provided by companies and verify producer claims. It answers the most important questions any analyst evaluating the industry should understand, including:
- Who has the best acreage?
- Who is the lowest cost operator?
- Who has the most room to grow?
Coverage Includes:
- Maps showing wellhead breakevens across producer acreage for the Marcellus, Utica, SCOOP, STACK, Permian, Eagle Ford, Bakken Haynesville, Fayetteville, Cotton Valley, DJ and PRB
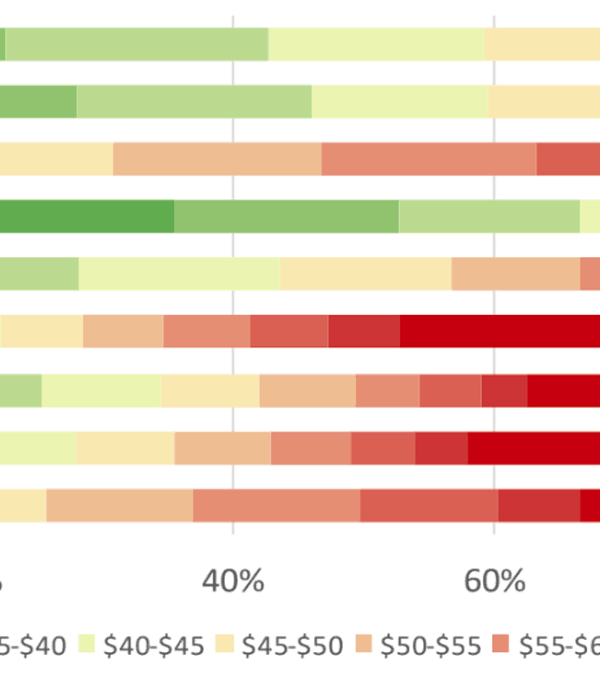
- Charts of wellhead breakeven by operator
- Production-weighted breakevens by operator including impact of differentials
- Maps showing remaining inventory in the Marcellus, Utica, SCOOP, STACK, Permian, Eagle Ford, Bakken Haynesville, Fayetteville, Cotton Valley, DJ and PRB
- Henry Hub, WTI and Basin differential forecasts
- Detailed lists of economic and inventory assumption