The longer WTI continues to trade in the low $30 range and the more E&Ps announce further capex and related activity cuts, the more interesting the declines in associated gas production outside of the Marcellus and Utica becomes. The industry commonly refers to the portfolio of wells providing production going forward as Proved Developed Producing (PDP). As unconventional activity has run its course over the last 10 years, the shape of PDP in any given play has changed and evolved based on producer activity.
One of the early knocks on shale gas development in the early days of the Barnett for example in 2005-2008 was the shale wells decline much more steeply than classic conventional production. And yes, many shale wells decline between 60%-85% in their first year of production. However, as producer efficiency evolved and IP rates climbed these IP gains more than offset steep decline rates. Shale play IP rates have evolved since 2008 when 1 MMcf/d was considered a great well to quickly elevating to 5 MMcf/d and more recently as the market has seen in some Dry Utica wells where 20 MMcf/d choked IPs have been achieved.
For this blog, the Eastern Eagle Ford BTU Production Sub-location was selected as an area of focus. We define this region based on geography rather than production exclusively from the Eagle Ford formation. If oil does stay ‘lower for longer and if Northeast pipeline expansion delays do in fact prevent the Marcellus and Utica from serving increasing demand in Texas and Louisiana, then other gas production areas are going to have to backfill to balance the market in 2017 and 2018. These areas would include the Eagle Ford, the SCOOP and STACK and the Haynseville/Cotton Valley. Below is BTU Analytics’ East Eagle Ford gross natural gas production forecast with PDP. This chart shows production plateauing in 2016 then ramping to 2021 as PDP declines away to less than 1 Bcf/d by 2021.
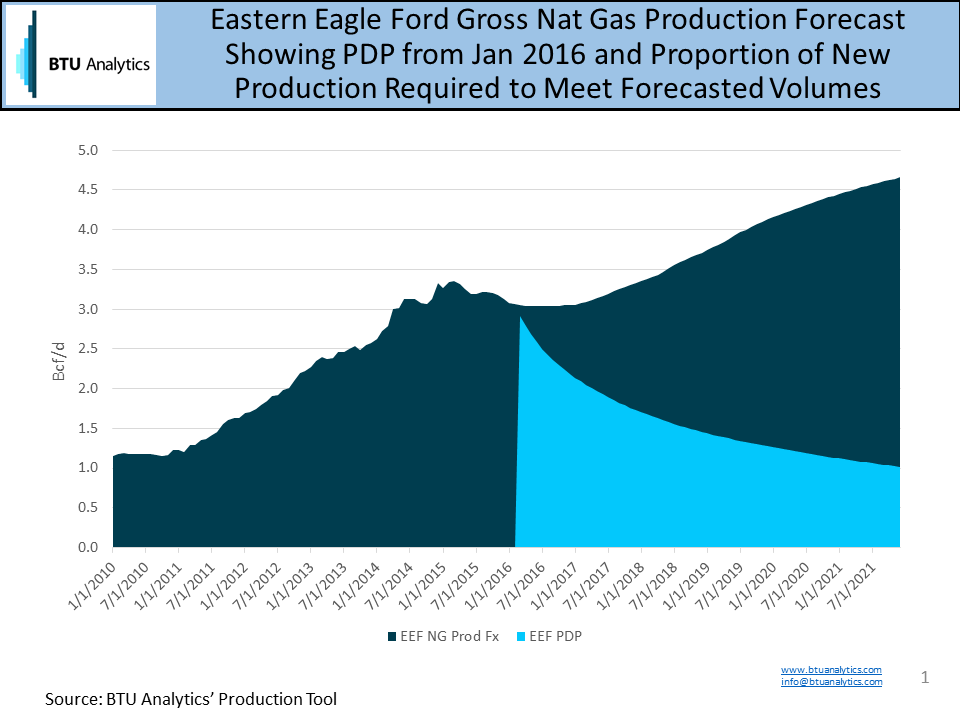
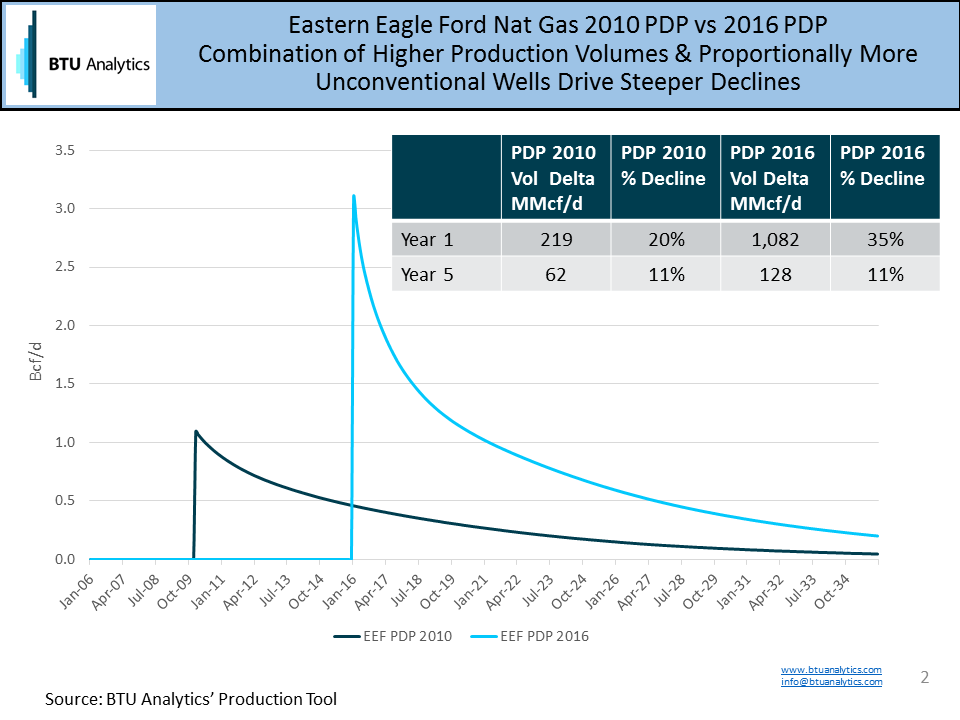
As unconventional Eagle Ford wells accounted for a greater proportion of production from the region, gas production from the area has grown higher and the PDP decline steeper. As an example, PDP in January 2016 is expected to drop over 1 Bcf/d over the next year or a 35% decline as compared to a 219 MMcf/d or 20% decline in January 2010 as shown in the chart below.
So what does this mean for the gas market? This means associated gas production in the Permian, Eagle Ford and Bakken is potentially going to decline faster than perhaps market participants expect. WTI ‘lower for longer’ sets the stage for natural gas to overcorrect too far in 2016 and into 2017 resulting stronger Henry Hub pricing (relative to today) to incent even potentially some dry gas production activity to balance the market as demand ramps materially higher into 2018 in the form of LNG, Mexican Exports, industrial and power demand. Follow BTU Analytics’ ever evolving analysis by subscribing to BTU Analytics’ Upstream Outlook.