


In Oklahoma, producers have perfected the art of branding. Two of the state’s most promising areas aren’t named for a single formation or basin as many of the well known US plays are, but rather branded with acronyms. The SCOOP (South Central Oklahoma Oil Province) and the STACK (Sooner Trend Anadarko Canadian and Kingfisher) have seen significant attention and excitement from both producers and the general market. Early well results have shown strong IP rates for both gas and oil. However, while improved techniques and more focused stacked play drilling efforts have given new life to the underlying formations of the SCOOP and STACK, these are not necessarily new plays. The Woodford Shale in particular has been actively targeted for many years. But now it seems like other Oklahoma producers have realized the importance of branding, and the Arkoma Woodford doesn’t want to be left out.
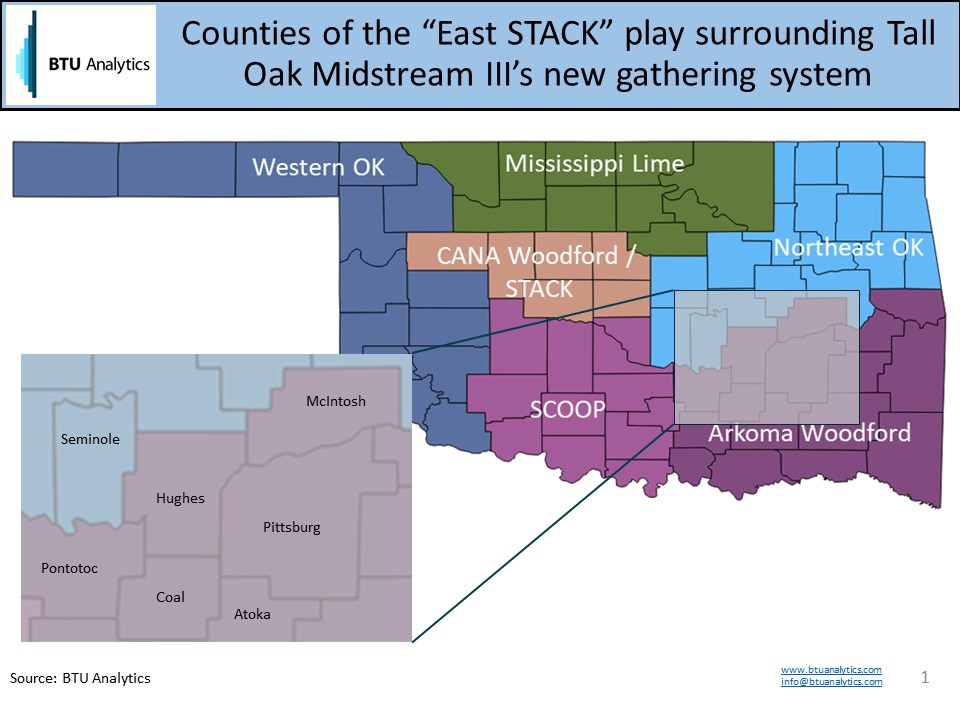
In September, Tall Oak Midstream III announced a new gathering system to service producers in the East STACK play. The system will primarily cover Hughes county in addition to Coal, Pittsburg and other nearby surrounding counties. These counties sit within the Arkoma Woodford footprint. But new branding and additional target formations (Caney and Mayes) may provide enough interest and investment to help grow the region. However, the counties in the Arkoma Woodford, as defined by BTU, have been declining for years, so is there any weight behind East STACK production?
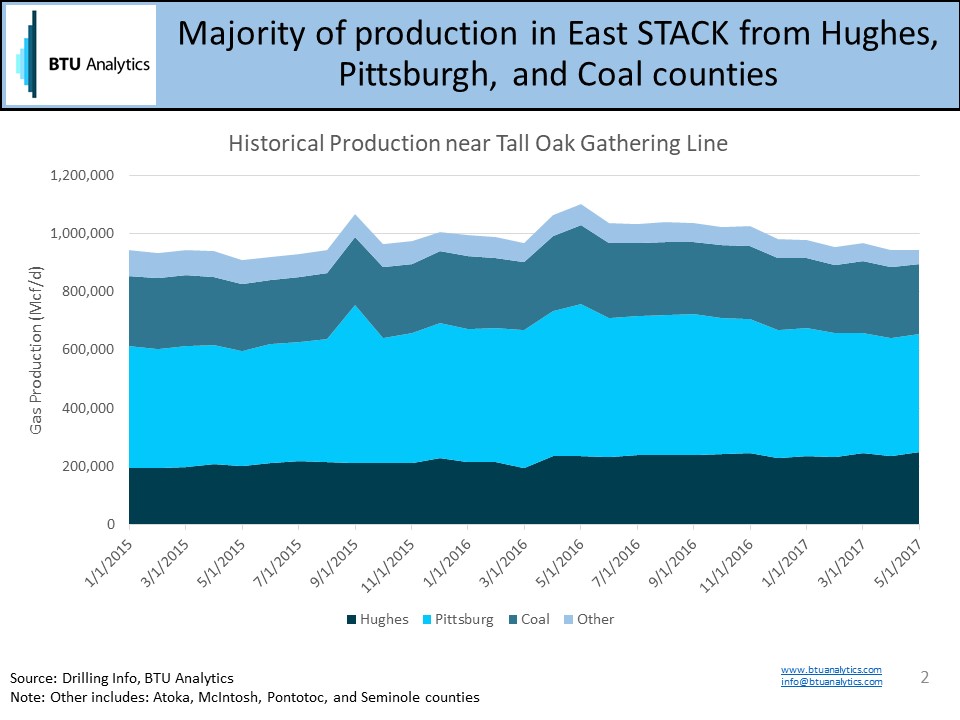
The chart above shows production from the counties to be serviced by Tall Oak Midstream III’s new gathering pipeline. While the growth isn’t as dramatic as what has materialized in the SCOOP and STACK over the same time frame, the annual average for these counties in 2016 is 70 MMcf/d higher than 2015. An analysis of the reservoirs being drilled shows an average of 86% of production is attributed to wells in the Woodford formation.
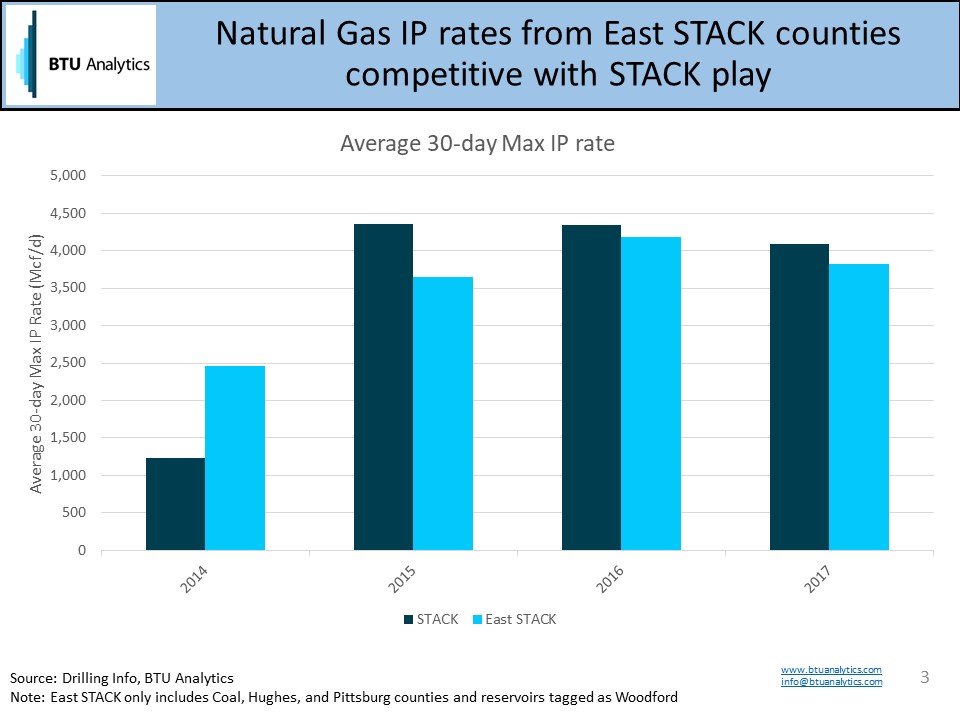
Despite lackluster production growth from the area, initial production rates for gas are on par with averages in the STACK play. The chart below gives average 30-day max gas IP rates for the STACK vs East STACK (which includes only Coal, Hughes, and Pittsburg counties). While the East STACK shows competitive natural gas IP rates, the liquids production from these wells was minimal, and plays driven by gas economics may struggle to compete with increasing production from the Northeast and associated gas growth from the Permian.
Similar to the STACK, the region being touted as the East STACK also encompasses both a dry-gas and a liquids-rich window. This could provide some uplift to well economics in the future. But will another gas-focused play in Oklahoma have much potential in the current market? For more information on BTU Analytics’ view of the natural gas markets, please request a free sample of the US Upstream Outlook Report.


