


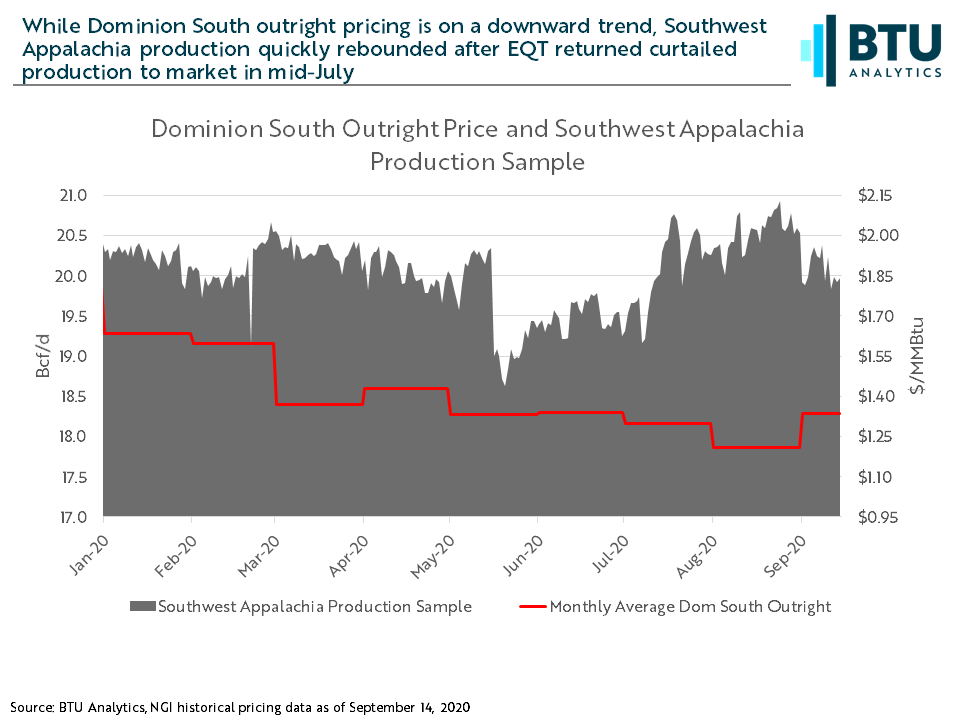
Southwest Appalachia gas pricing and gas production have been on opposite trajectories through August; while pricing has generally trended down, production has stayed strong. After EQT returned 1.4 Bcfe/d of shut-in production to the market in mid-July, Southwest Appalachia production climbed, peaking at 20.9 Bcf/d in August, just 0.30 Bcf/d lower than the record 21.1 Bcf/d reached in November 2019. This Energy Market Insight will examine what could be driving production up, such as a shift in completions within the region, a short-term boost in well productivity, or high-grading.
In the first half of 2019, the top six operators in Southwest Appalachia combined to make up about 60% of the 491 new horizontal wells placed on production. In the first half of 2020, the top four operators accounted for 60% of the 321 new horizontal wells placed on production. Total new wells on production in Southwest Appalachia are down year over year, so it is not just additional completions driving production. With fewer operators making up an increasing share of new wells on production, well performance on an operator level can disproportionately impact regional production.
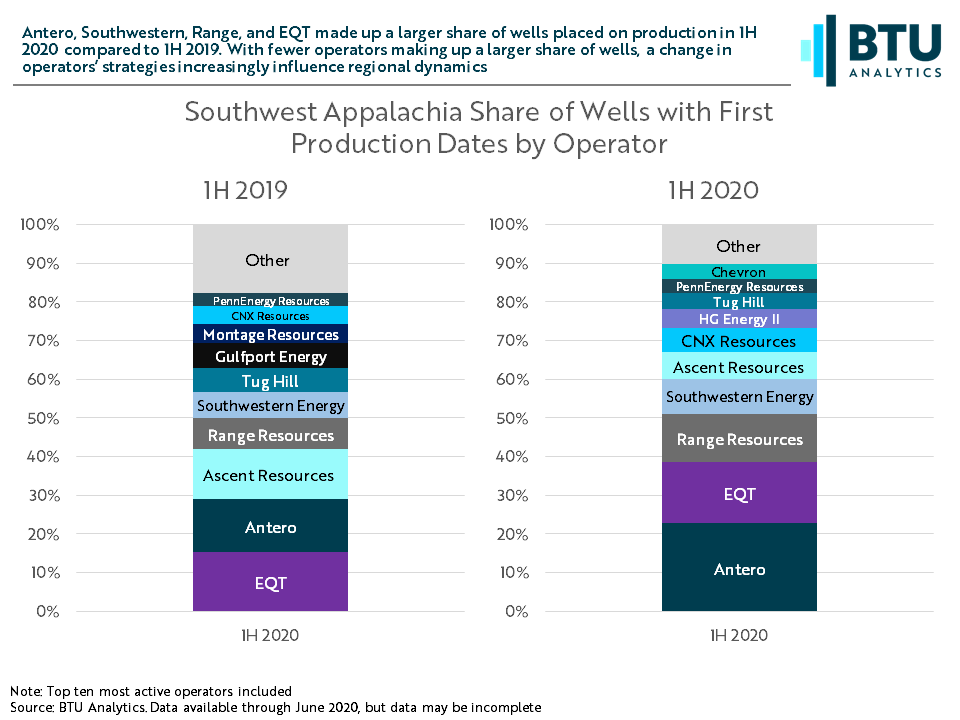
Over half of the wells placed on production by the top operators in Southwest Appalachia are in West Virginia, driven by Southwestern and Antero, so this insight will focus on analyzing well-level performance metrics in West Virginia. However, lateral lengths and IP rates have increased year over year across Southwest Appalachia, so while West Virginia is not the only area driving the region’s production bump, activity there is making a significant contribution.
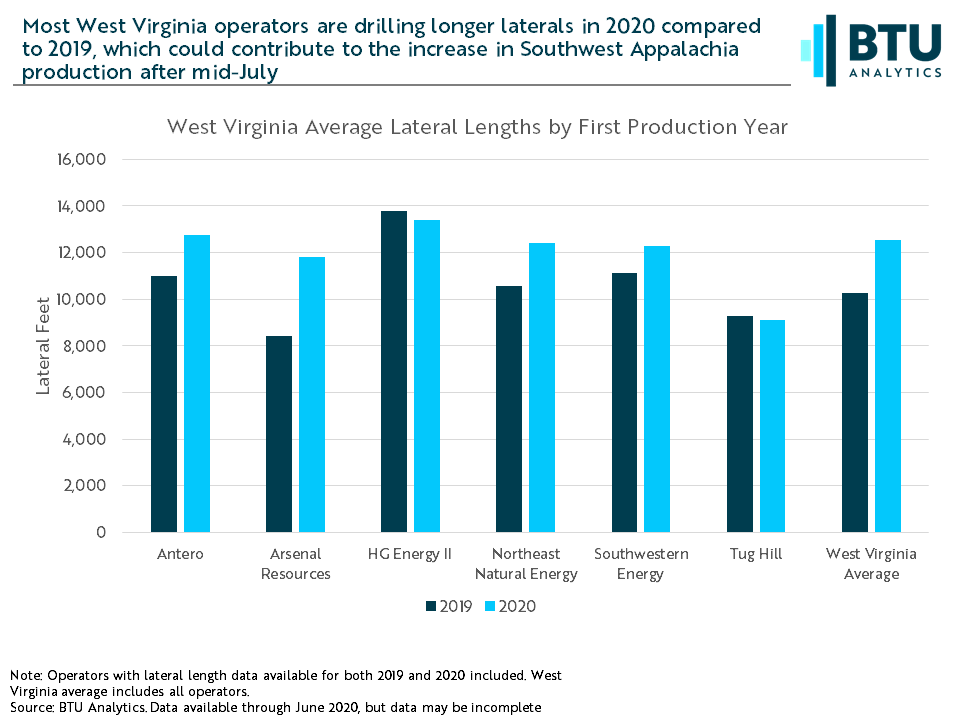
Both Southwestern and Antero are, on average, drilling longer laterals in West Virginia compared to first half of 2019 averages. Southwestern’s first half of 2020 laterals averaged 12,293 feet and Antero’s laterals averaged 12,761 feet. 50% of Antero’s first half of 2020 wells are at or above the 12,761 feet average, indicating that it is not just a few ultra-long lateral outliers driving this trend. Excluding one 20,081-foot ultra-long lateral for Southwestern, their first half of 2020 average falls to 11,982 feet, still 17% higher than their first half of 2019 average.
Drilling longer lateral wells can boost production in the short-term as longer laterals typically produce more gas in the first couple months of production than wells with shorter laterals. Digging deeper into measures of productivity can help us understand whether this boost in production is being driven solely by long laterals or if operators are influencing other productivity metrics to boost production.
When operators are drilling longer laterals, this pushes the average initial production rate for a region higher. West Virginia average initial production rates climbed from 9,770 Mcf/d in 2019 to 13,315 Mcf/d in 2020. Normalizing initial production rates and type curves to account for longer laterals helps show us whether higher initial gas production is driven solely by long laterals. In West Virginia, lateral normalized gas type curves for the state show us that longer laterals are not the sole driver of the increase in initial production rates. From 2016 – 2019 the lateral normalized initial production rate for West Virginia wells stayed relatively flat, averaging 964 Mcf/d per thousand lateral feet. But in 2020, the normalized initial production rate has jumped to 1,136 Mcf/d per thousand lateral feet. This is the highest jump of the areas within Southwest Appalachia with relatively complete data for the first half of 2020. This means that operators in West Virginia are drilling more productive wells (as measured by initial production rates) even when accounting for the influence of longer laterals.
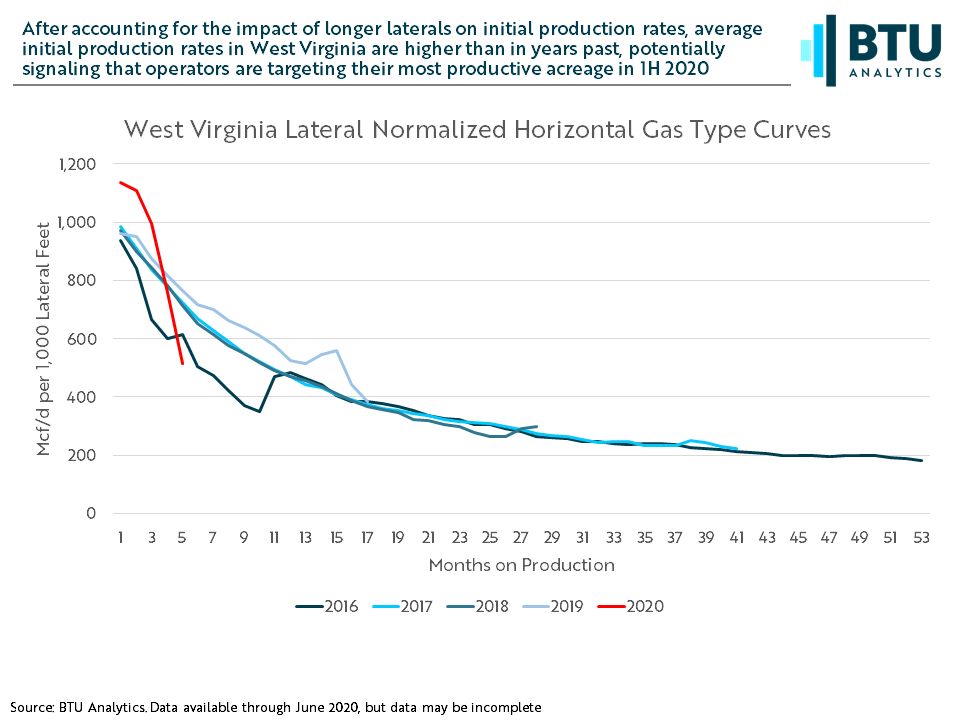
This could indicate that operators in West Virginia are high-grading – allocating capital to and completing wells on their most productive acreage. This drives productivity metrics like initial production rates higher, boosting production even as operators keep the number of new wells placed on production steady. While normalized IP rates are slightly higher in 2020 in other areas in Southwest Appalachia, West Virginia data shows the most compelling evidence for high-grading. The increase in normalized initial production rates in West Virginia is being driven by Southwestern, whose lateral normalized initial production rates increased 40% year over year. While Antero’s lateral normalized initial production rates do not follow the same pattern, they are adding to the climb in production by drilling longer laterals and completing more wells year over year.
The continued growth in Southwest Appalachia production since mid-July, even in this low-price environment, is likely being driven by a combination of factors across the region. While some operators are seeing production increases by drilling longer laterals and completing more wells, others appear to be keeping completions flat but targeting higher productivity acreage, most clearly seen in West Virginia. Both strategies boost production in the near-term, but if operators like Southwestern continue to target their most productive acreage first, this could lead to a longer-term shift in productivity in the region. With Southwest Appalachia production already pushing the limits of long-haul infrastructure, this could lead to battles for market share between producers. Time will tell whether this a short-term strategy while prices are weak, or if this will be a fundamental shift in West Virginia type curves. Production forecasts, regional type curves, and other productivity metrics are available in BTU Analytics’ Upstream Outlook.


