Average stock performance for independent E&P companies has struggled as oil and gas prices have weakened moving through 2020. WTI oil prices have fallen almost 20% and are hovering just above $50/bbl on global demand concerns. Additionally, natural gas pricing at Henry Hub continues to average just above $2.00/MMbtu for the summer. However, certain basins and operators continue to fare better than others as will be discussed in today’s Energy Market Commentary. Operators with strong underlying well economics have generally outperformed their peers.
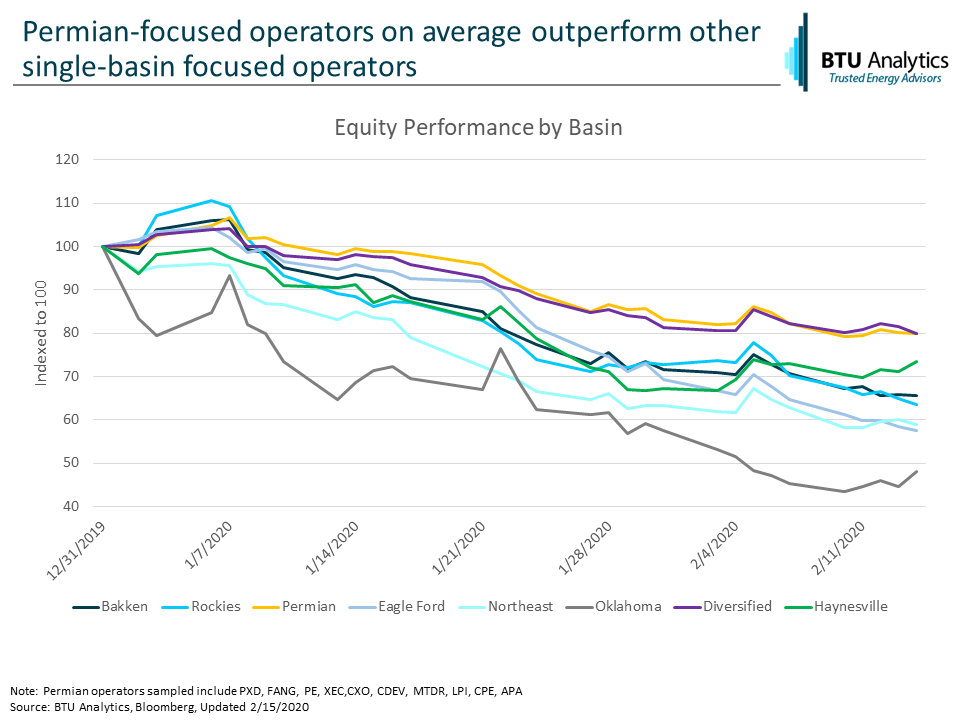
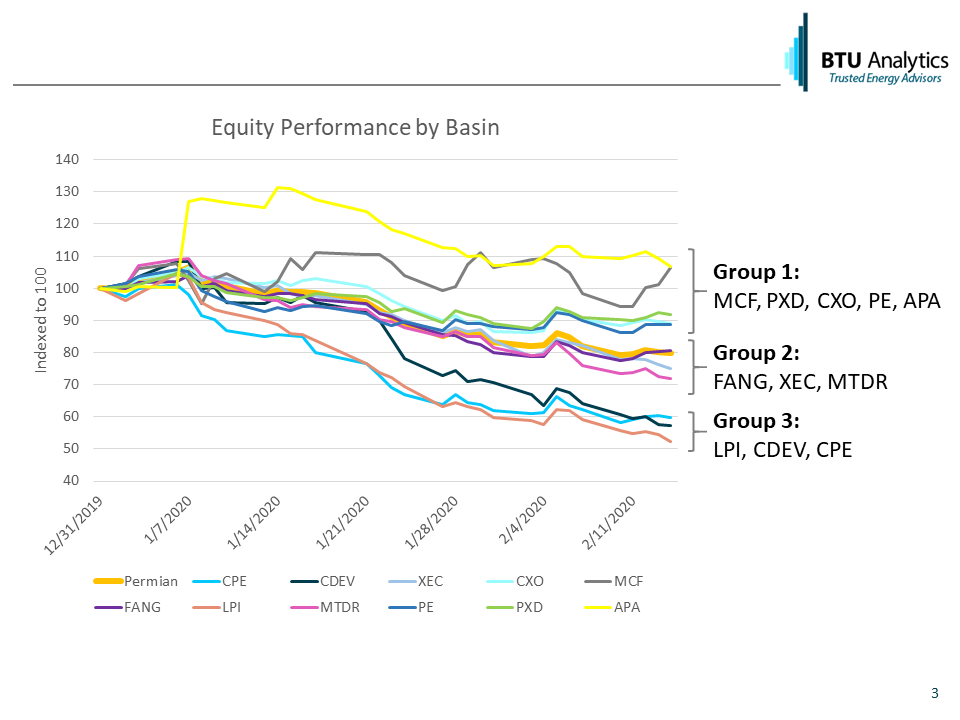
The chart above highlights that “Permian-Focused” E&P companies have on average maintained stock prices in 2020 relative to their peers in other basins and show only a 10% loss in stock value compared to more than 50% for Oklahoma-focused producers. However, buyer beware, as highlighted in a previous BTU Analytics’ Energy Market Commentary, just because an operator is in the Permian does not mean they have economic acreage that allows them to maintain positive cash flow in a $50/bbl oil price environment. In fact, some of the Permian operators included in the average Permian stock price chart above have seen stock price declines to the tune of almost 50%. So why are some operators performing better than others? Is it the quality of the underlying rock? Is it their efficiency in operations? Is the quality of remaining drilling locations?
In order to help our clients gain clearer insight into US E&P companies and allow comparisons across basins, companies, and within plays, BTU Analytics recently launched the BTU View service. The BTU View not only lets you visualize summary data based on well-level estimates for breakevens, D&C costs, GPMs, and much more, it also allows you to export all of this data to be used in your own in-depth analysis and mapping tools.
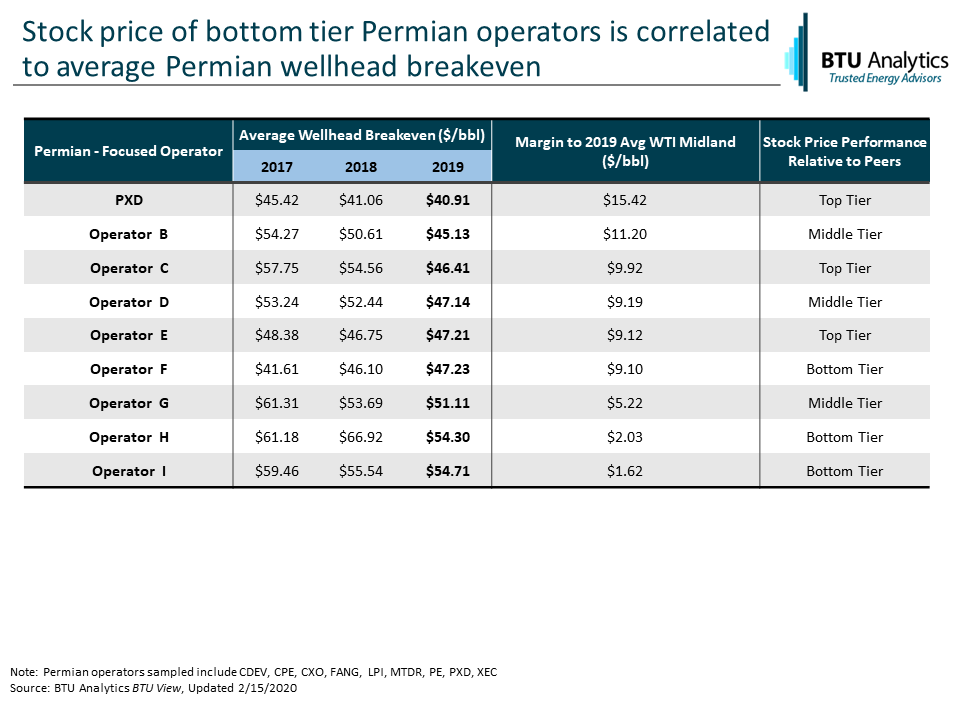
The chart below is an example of output derived from exporting and analyzing this dataset. The average wellhead breakeven in the Permian Basin for 2019 was $48.28/bbl and the chart highlights that some key Permian operators like CPE, PXD, FANG, XEC, etc. have lower breakevens while others are well above the average for the Permian.
Tying these breakevens to YTD 2020 stock price performance shows that lower breakeven price is correlated to the higher performing stocks. Pioneer (NYSE: PXD) had an average wellhead breakeven $15/bbl lower than WTI Midland pricing in 2019 compared to Operator I who only showed $1.62/bbl margin to WTI. However, this is only part of the picture. In addition to the half-cycle breakevens show here, there are other costs including SG&A and interest expense that must be covered and, based on a recent BTU Analytics analysis, added anywhere from under $1.00/boe to almost $12.00/boe. For more information and access to a tool to help you make better investment decisions, request a demo of the BTU View today.