


Waha natural gas cash prices traded as low as a negative…yes negative…$6.60/MMBtu on April 3 and averaged for the day nearly $3.75/MMBtu below zero. Permian producers are paying for the right to produce oil, avoid flaring, and potentially not see producing wells shut-in due to natural gas pipeline constraints. Today, BTU Analytics will review the impacts on well by well profitability and the potential implications of negative natural gas prices on natural gas and oil production.
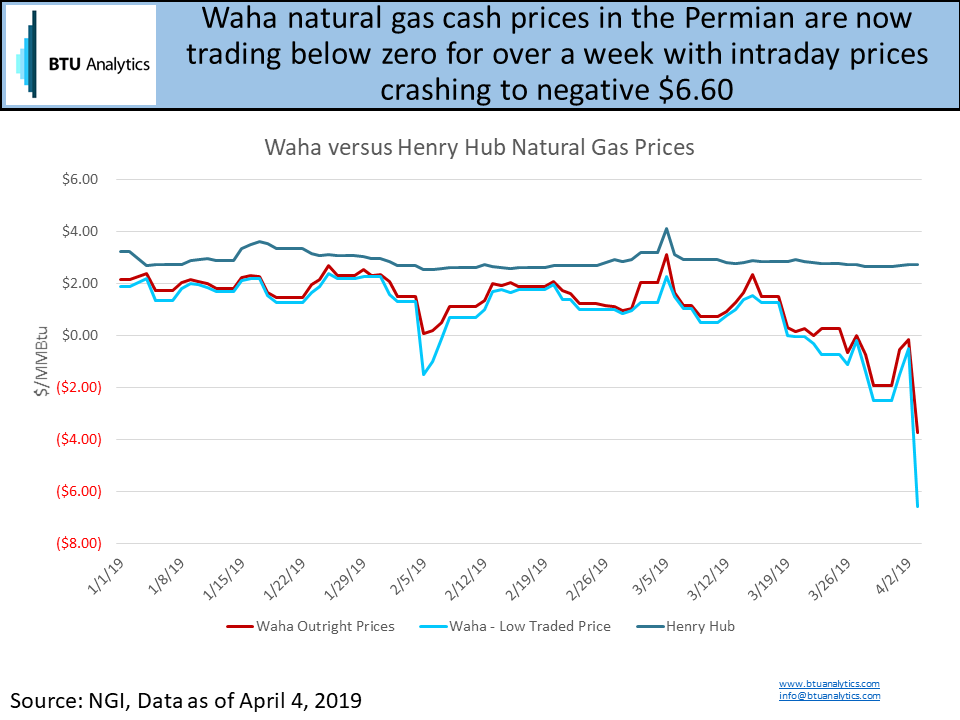
The chart above shows Henry Hub, Waha average cash prices, and Waha low traded cash prices since January 1, 2019. Waha prices first broached negative territory on February 5th before recovering back to nearly $2.00/MMBtu for the majority of February. The recovery in prices was driven by cold temperatures boosting demand and disrupting Permian supply (as highlighted in Permian Freeze Off’s Ahead) as Midland temperatures dropped to as low as 24 degrees Fahrenheit on February 9th.
Then as producers entered March, two new crude pipelines began operations boosting crude oil takeaway capacity. The 45 Mb/d Midland to Sealy expansion went into service followed by the 200 Mb/d conversion of the Enterprise NGL pipeline. Utilizing BTU Analytics’ Upstream Outlook type curves, for every barrel of new oil production in the Permian, on average, producers generate an additional 1.88 Mcf of associated gas production. If both lines have reached full capacity, then the Permian could have generated an additional 460 MMcf/d of natural gas production on average in March and April. Some of these volumes likely went to the flare stack, but as evidenced in Waha basis, some of these volumes are hitting an already constrained pipeline grid.
The question then remains, how low can Waha prices go before producers decide to stop selling natural gas and begin shutting in a well? To help quantify that answer, BTU Analytics pulled well by well production data for the Permian in Texas and New Mexico. To simplify the analysis for this commentary, let’s consider where net revenue from oil and natural gas sales is zero as the shut-in point. Midland crude oil prices are currently trading at $60/bbl. As an example, if a producer sold 1 barrel of oil for $60/bbl and 10 Mcf of gas at a negative $6.00/MMBtu, the producer would generate zero net revenue.
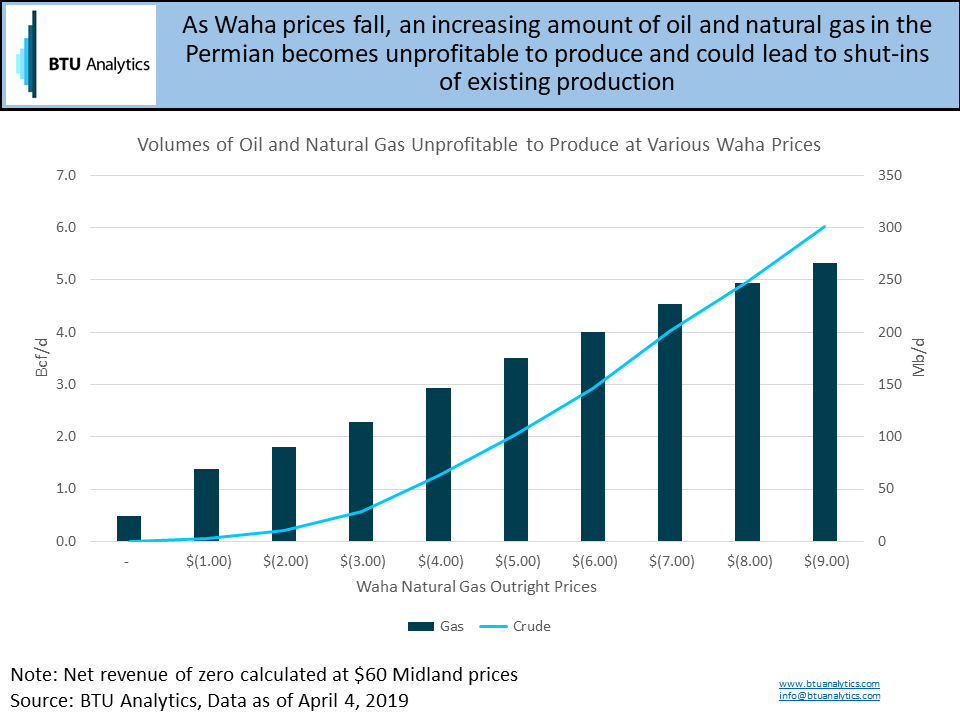
The chart above highlights the volumes of natural gas (left axis) and oil volumes (right axis) at various Waha outright prices that would generate negative to zero revenue if produced at $60 Midland oil prices. As Waha prices fall to zero, legacy natural gas production unassociated with oil production is the first to fall from the stack. As of July 2018 (the latest complete well level production data), nearly 0.5 Bcf/d of volume would fail to generate positive revenue if Waha priced at zero. Then as Waha prices continue to decline, the volume of natural gas becoming unprofitable to produce escalates rapidly. At yesterday’s -$6.60 low price nearly 4.0 Bcf/d of natural gas and 150 Mb/d of oil may have been unprofitable to produce.
Operationally reacting to intraday and even daily spot cash prices is a significant challenge for producers. Thousands of wells need to be switched offline to make an impact on total natural gas production. Additionally, the leanest gas producers in the region bear the greatest incentive to have hedged or own firm transport out of the region potentially leaving most of their volumes less exposed to spot pricing. With significant volumes of production already under duress, production shut-ins are likely forthcoming to help ease congestion. However, new build oil pipelines in EPIC and Cactus II will enter service this summer setting the stage for calamity for Waha natural gas prices until new gas pipeline capacity arrives. BTU Analytics’ April 2019 Upstream Outlook will feature in-depth analysis on new pipeline capacity additions this summer and potential producer-level impacts of falling Waha natural gas prices.


