Across the country we have seen that with the addition of any intermittent generation comes increased volatility and a change to generation profiles. This includes Florida, where solar capacity has grown aggressively over the past 5 years and is expected to continue to grow thanks to new projects being developed mainly by Duke and NextEra. Previously, we looked at how net load (electricity demand less renewable generation) will change during the summer; today we will look at how winter will see its net load profile altered much more.
Two major factors will change seasonally in Florida that will lead to a much more exaggerated ‘duck curve’: solar capacity factors and load. First, in the winter the sun sets earlier in the evening leading to less hours of sunshine. Not only that but solar generation drops off faster in the winter, as shown in the left graphic below. If solar generation drops off faster, than other forms of generation will have to kick on to account for the loss of supply.
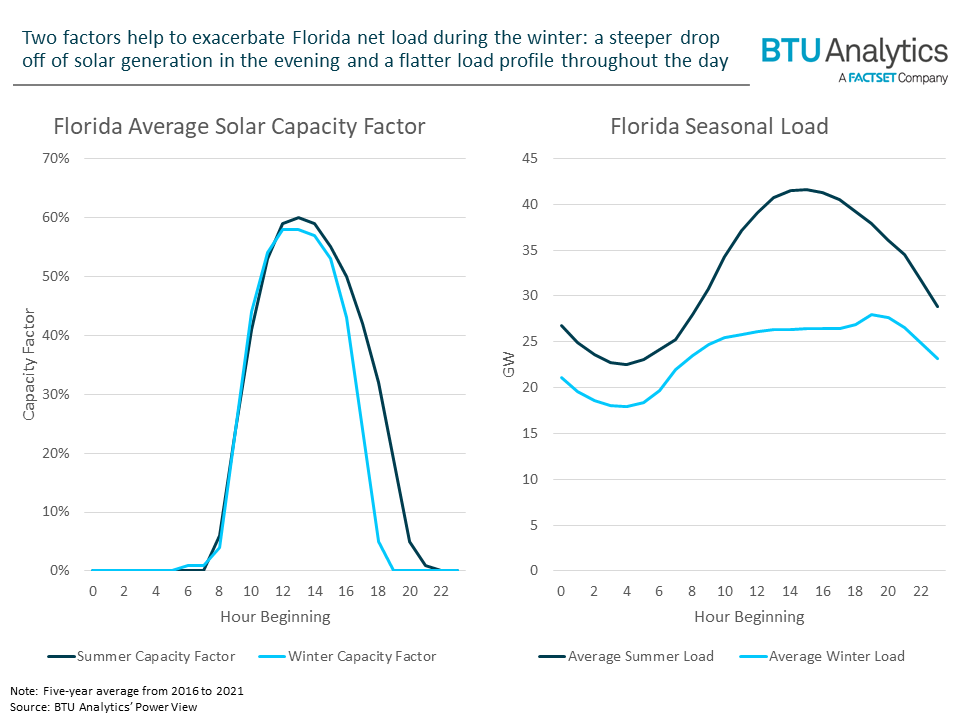
The second factor at play in Florida is seasonal load profile, which in the winter is much flatter throughout the day versus what we see in the summer. Summer load peaks when solar is peaking, however since winter load is flat while solar generation peaks, the net load curve will be driven down further.
The following graphic combines these factors together into winter net load curves. Each line represents a different level of future solar buildout and the impacts that those projects are expected to have on the net load curve. Over the next few years, BTU expects an additional 4.2 GW of solar capacity to enter the Florida market, as shown by the third gray line.
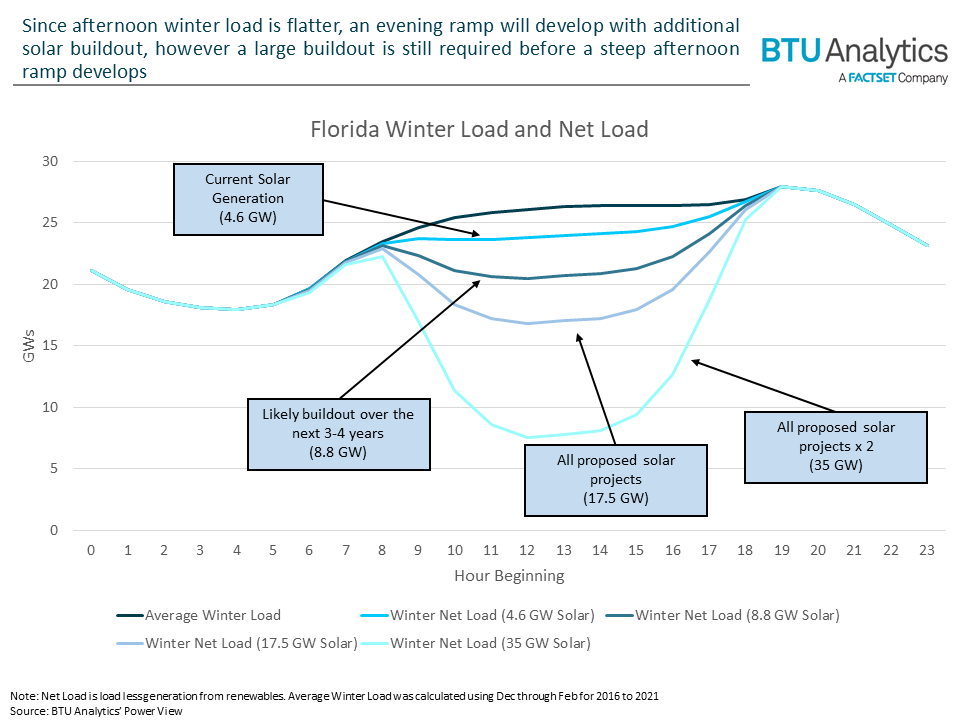
Lines further down represent more aggressive buildouts that include all proposed solar projects in Florida and all proposed projects doubled. This shows that a winter duck curve will develop in Florida, however it still requires a large buildout before a steep afternoon ramp develops. When the duck curve does start to deepen, expect it to be seasonal with larger generation ramps needed in the winter than the summer.
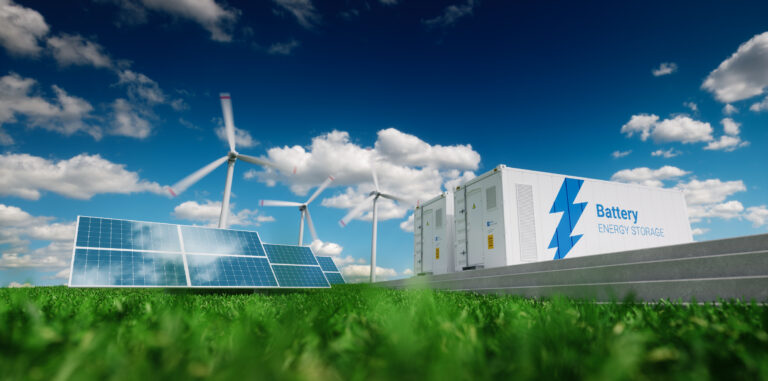
There are two obvious solutions to meet that afternoon ramp: quick-fire natural gas power plants and battery storage. However, natural gas plants are facing a similar pushback from the ESG movement that coal plants have been experiencing for years. BTU Analytics is currently tracking about 40 GW of natural gas retirements, which amounts to 7% of the current US fleet. As pressure on decarbonizing the power sector continues to grow, expect natural gas plants to feel that pressure acutely and leave open an opportunity for energy storage to step in and fill the gap. For more on new projects, retirements, and energy storage opportunities, see BTU Analytics’ Power View.