In 2015 and 2016, producers went on a buying bonanza snapping up Permian acreage. The prospect of stacked pay potential with ultra low break-even prices sent producers in a bidding frenzy. In the chase for the best acreage, prices went as high as $60,000 per acre. Now that the Permian land grab has slowed, has all that stacked pay potential been proven?
Today, producers in the Midland and Delaware list a multitude of reservoirs available for development on their acreage, but some of those producers have began drawing attention to the economic differences between each reservoir as they test out their acreage and the various stacked pay opportunities.
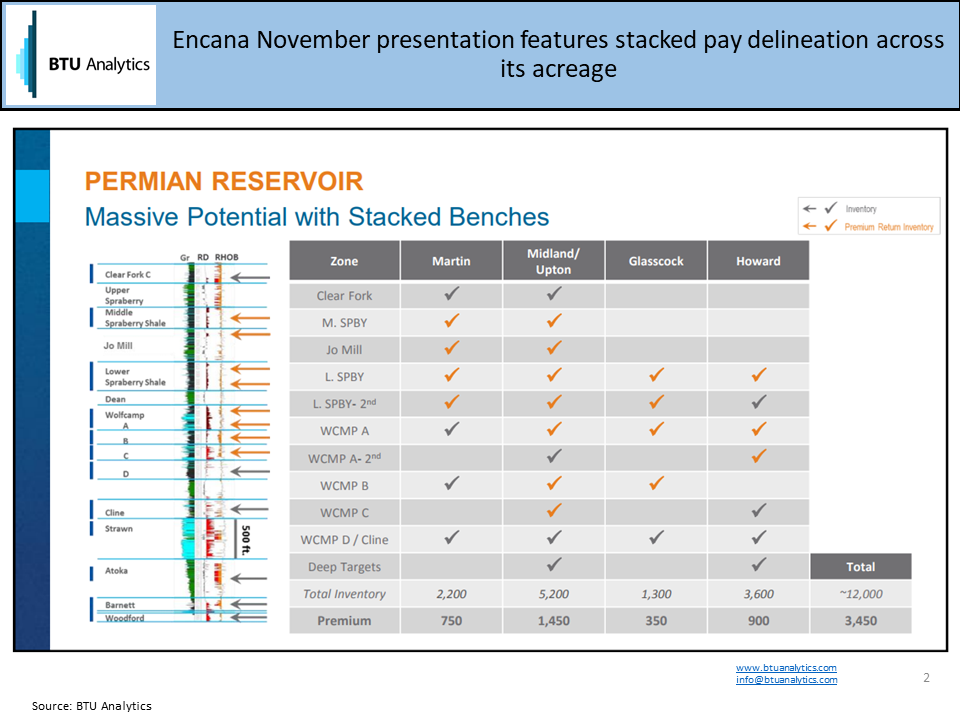
These test wells have resulted in producers delineating their ‘premium’ locations from everything else in their undrilled inventory, as seen in the chart below from Encana’s November 2017 investor presentation. While the premium qualification can vary from producer to producer, it is typically based on the perceived economics of the well at given commodity prices. This distinction is important as players move towards more full-scale development.
In order to understand the extent of proven stacked pay potential, BTU Analytics categorized every single horizontal well in the Permian by horizon. For more on the analysis and methodology, see our October 2017 E&P Positioning Report.
In the Midland Basin, BTU Analytics targeted five separate horizons: the Spraberry and Wolfcamp A-D, with all other reservoirs aggregated in an “Other” category. As seen in the chart below, which shows the breakeven distribution between the various plays, the Spraberry boasts the highest proportion of wells drilled with a breakeven lower than $40/bbl since 2016. Almost 40% of Wolfcamp A and C wells breakeven below $40, followed by about 25% for Wolfcamp B.
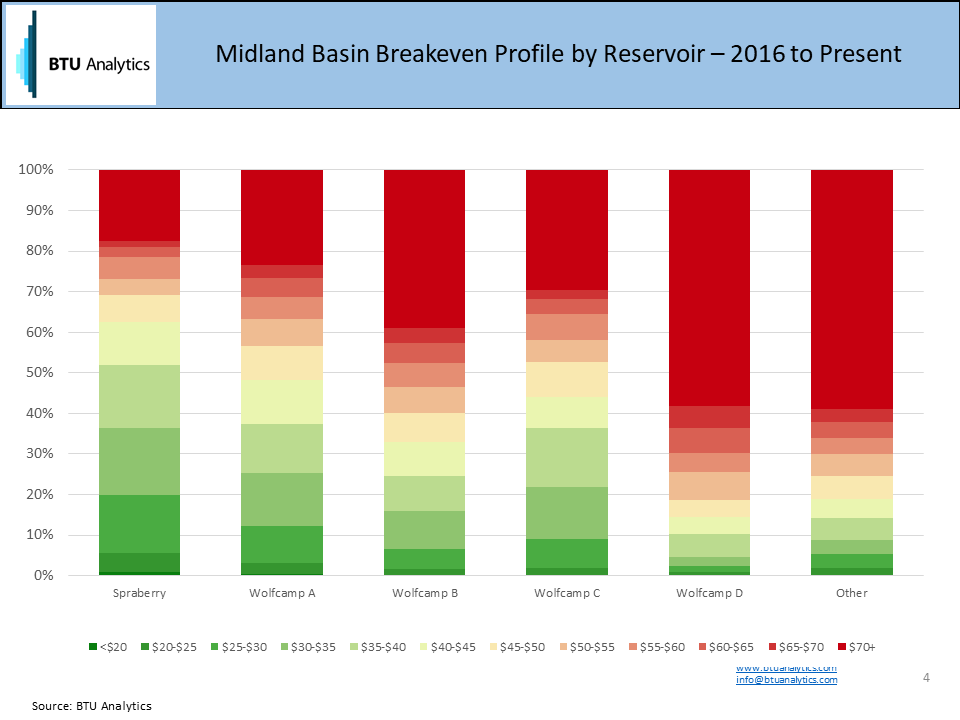
However, more than half of the Midland wells in our economics sample that fall into one of the five main horizons are in the Wolfcamp B, signaling its relative potential and viability across the basin. This is in contrast to the Wolfcamp C and Spraberry, which have been targeted by far fewer wells.
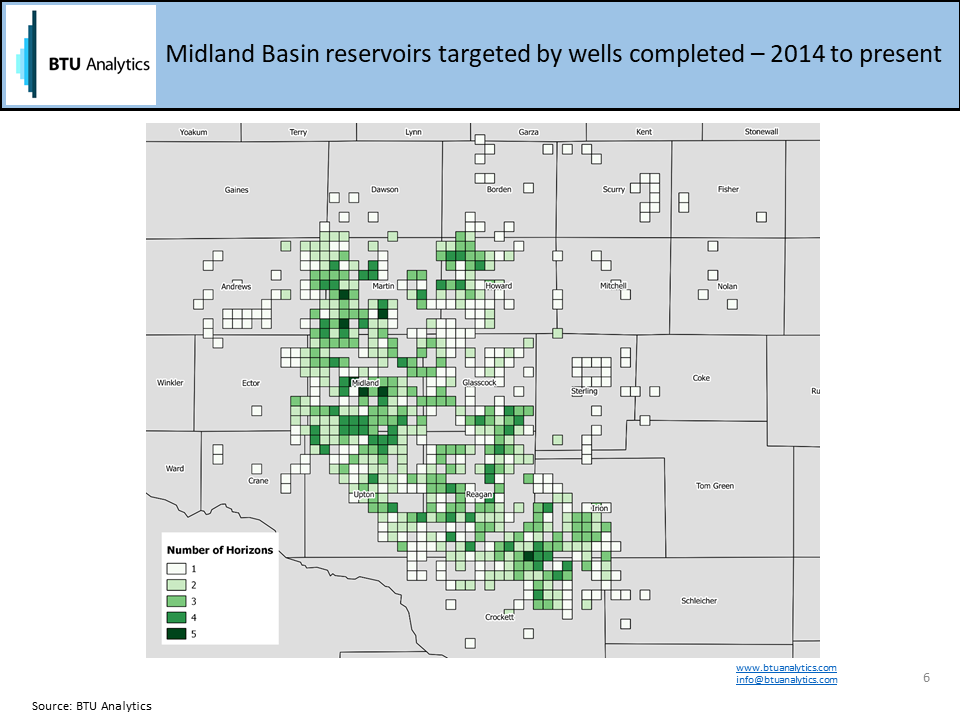
Reservoir mapping reveals where operators are closer to full-scale stacked pay development in the Permian. In the map below, fringe acreage in the Midland Basin has typically only targeted one or two horizons. In Midland, Martin and parts of Howard counties, producers are typically developing three or more horizons. The higher number of horizons developed points to why these areas garnered such high acreage prices in 2015 and 2016.
This is important as we consider the true economics of the stacked pay opportunity in the Permian. BTU Analytics estimates inventory of remaining locations by breakeven across all the major shale basins. In the Permian, the analysis involves estimating the remaining number of well locations by horizon, only assigning breakeven estimates to locations in grids where each horizon has been successfully drilled and completed. While conservative, BTU Analytics believes this methodology provides a more clear picture of the economics of the remaining well inventory.
On average, producers have produced from two horizons within each grid. But that statistic doesn’t provide the full picture. For instance, in Midland county, producers are targeting three or more horizons in almost every grid. Infringe counties like Andrew, Crane and Sterling, typically only one reservoir has been targeted. Estimating inventory utilizing a blanket assumption on number of horizons would overestimate the number of locations likely available in these areas, while underestimating that in Midland County.
Much of the Permian may have stacked pay potential, but the economics of those reservoirs will in part decide whether or not it will actually get developed. BTU similarly maps out the distribution of breakevens by reservoir in the quarterly E&P Positioning Report, providing insight into what acreage is best suited for development of each play. Request a copy of the report today.