A new year greets the energy market, and many operators are likely saying ‘good riddance’ to 2019 after commodity prices fell and equity prices plummeted. While many recent news articles are painting a picture of a US shale industry on the ropes, including coverage of producers missing forecasts and tightening financial pressure, the current rig count indicates that despite a greater focus on capital discipline, more production growth is still ahead. Today’s energy market commentary dives into the production implied by current rig activity, with the reminder that the relationship between rigs and production is hairy one at times.
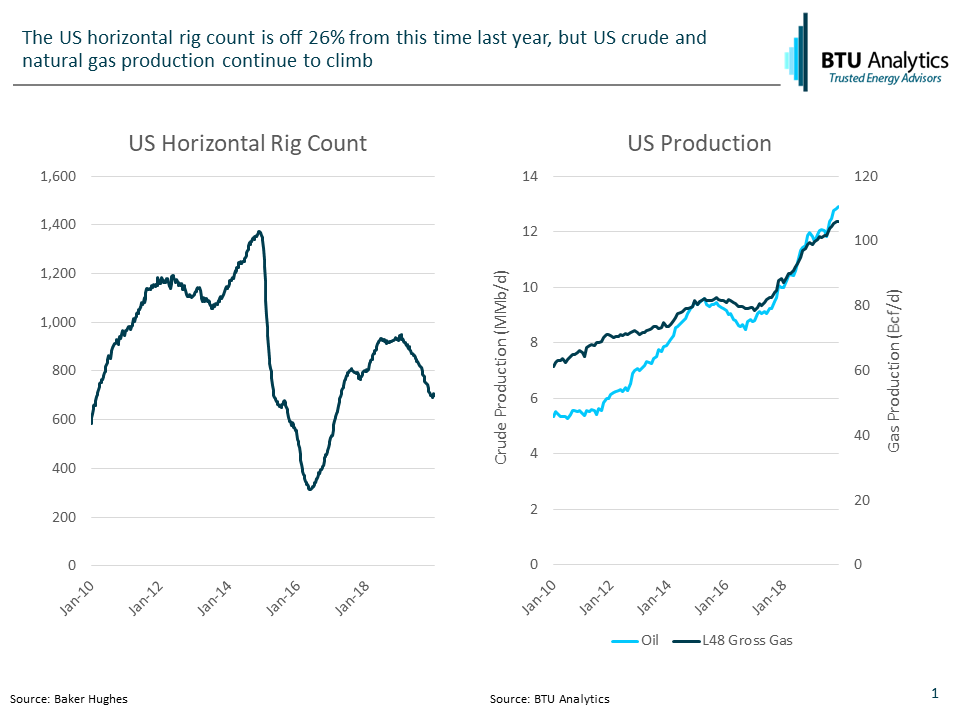
The US horizontal rig count fell through most of 2019, with the current rig count 26% off the peak. Despite the drop, both oil and gross gas production continued to climb. Industry watchers focus on rig counts because the numbers are released weekly and aren’t as lagged as other market indicators such as state reported production, but decreasing drilling times, well productivity and where the wells are being drilled make rig count comparisons through time relatively meaningless on their own.
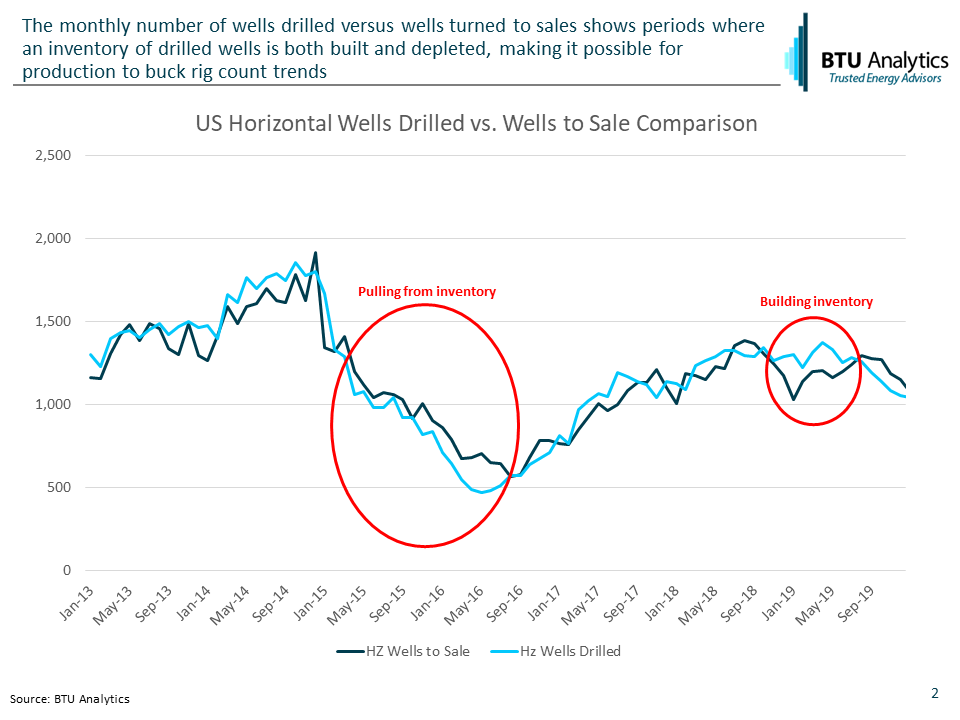
The other major obstacle to using rigs as an indicator of future production is the dreaded DUC issue. We’ve written about DUCs at length (See here, here, here, here, etc.) A key characteristic of US shale development is pad development, where multiple wells are first drilled in sequence then completed and turned to sales after all wells have been drilled. The time that it takes to develop a pad (generally referred to as spud-to-sales time) can span the better part of a year, and at times drilling can outpace completion activity and vice versa. The chart below highlights US horizontal wells drilled versus wells turned to sales over the past six years. Notice that following the crude price crash of 2014 wells to sales outpaced wells drilled for approximately 18 months, while the opposite trend was true for the first half of 2019, setting up the current situation where wells turned to sales is outpacing drilling activity.
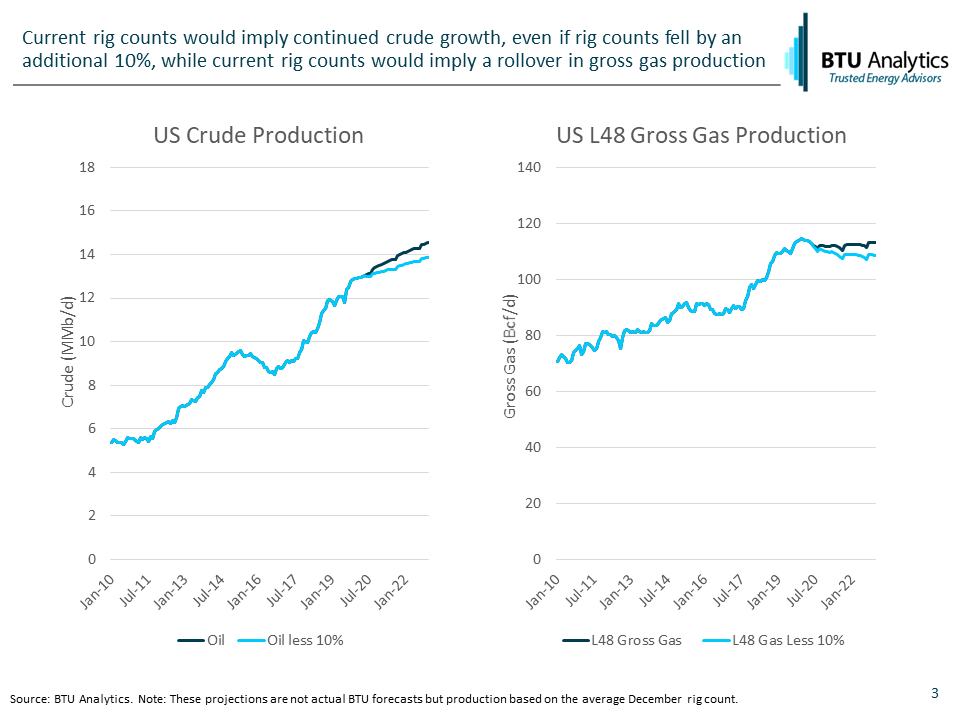
Despite all the aforementioned issues with using rigs to forecast production, what production inferences might be made from the current rig count? Using drilling productivity figures consistent with the second half of 2019, BTU Analytics’ proprietary well productivity estimates within the 80 sub-regions BTU divides the US into and a generic spud to sales assumption of 6 months, the current rig count would be expected to grow crude oil another 1.6 MMb/d over the next three years while gross gas would peak at year-end 2019 before flattening out at 112-113 Bcf/d through 2022. Decreasing the rig count by 10 percent would result in crude growing approximately 1.0 MMb/d and gross gas falling by 5.8 Bcf/d by the end of 2022. Note that neither projection considers the potential impact of infrastructure or gas flaring.
Despite the difficult market, rigs are implying that US crude production is still set to grow. Is that what will actually happen? How will Permian DUCs impact US production? How will flaring, infrastructure, and gas producer hedges distort gas markets in 2020? For this and more, request more information on BTU Analytics’ Upstream Outlook, Oil Market Outlook and Gas Basis Outlook services.