Over the past few weeks, the energy market has been turned on its side because of the events in Ukraine. Russia is the world’s second largest energy producer and countries in the European Union rely heavily on Russian fossil fuels. As majors like BP, ExxonMobil, Shell, and Equinor plan to exit their Russian operations, the loss of expertise from Russian oil fields is likely to weigh on the long-term sustainability of Russian oil and gas production.
In the past, U.S. shale might have reacted quickly to ramp activity and deliver new supply to market. However, BTU Analytics expects several near-term headwinds to challenge any large production response to the recent spike in oil and gas pricing. In the long term, even a partial replacement of Russian energy exports will require additional fossil fuel infrastructure, which faces its own financial and political risk. Here we focus on these risks and how they impact BTU Analytics’ U.S. oil production forecast.
Surging Prices
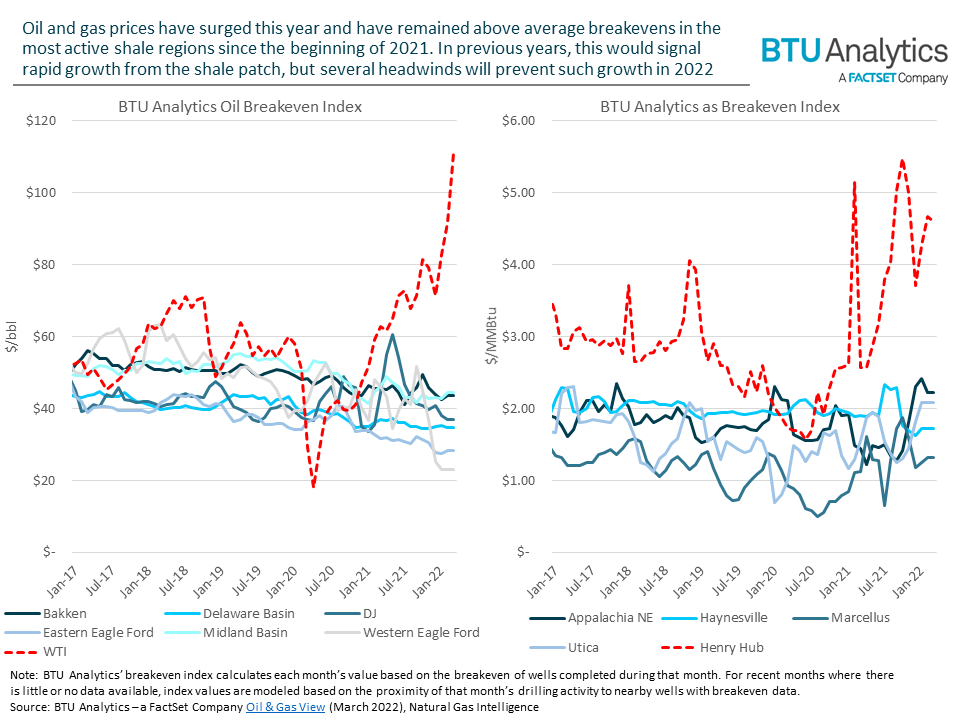
At first glance, the rise in oil and natural gas prices from their 2020 doldrums has allowed U.S. producers to grow cash flow at a rapid pace. The charts below show how market prices for oil (left) and natural gas (right) have risen far above average breakeven prices for the most active shale regions in the U.S. In this context, a breakeven represents a flat price that a producer would need to receive on the oil or gas production from a single well over its life to produce a 10% internal rate of return (IRR).
Many factors can impact breakevens, but the most significant are generally the capital spend needed to drill and frac a well, the amount of oil and gas the well produces, and the price received for other hydrocarbons produced from the well (for example, a shale oil well also typically produces natural gas and natural gas liquids). As the chart below shows, the significant rise in market pricing above average breakevens is rare, providing a cash windfall to most producers in the U.S.
Capital Constraints
In years past, this sharp increase in market prices would accompany a significant redeployment of capital into the shale patch. However, years of poor returns on capital resulted in investors pivoting away from the sector, which was only exacerbated by the COVID-19 pandemic. During that time, publicly traded exploration and production companies (E&Ps) in the U.S. focused on strengthening balance sheets to withstand the commodity cycle and returning cash to shareholders.
The chart below breaks out the percentage of cash flow from operations that were deployed to capex, debt reduction, share buybacks, and dividends. At least for now, capital expenditures invested into oil and gas production will need to fit within this framework—not the other way around.

Other Constraints Faced by E&Ps
In addition to the financial constraints on public E&Ps, producers across the shale patch are limited in their ability to ramp up activity by labor constraints and material cost inflation. The most significant impediment to a U.S. production response in 2022 is tightness in the well completions market, or the process of fracking and turning a well to production.
In January, Halliburton reported in the company’s fourth quarter earnings call that “the North American completions market is approaching 90% utilization and Halliburton is sold out.” Liberty Oilfield Services reported a similar assessment, also indicating that new capital spending is aligned with offsetting equipment at the end of its useful life and not necessarily adding new capacity. As equipment and replacement parts have become tight, the producer price index (PPI) across oil and gas operations has risen at or above 2018/2019 highs.
In addition to tight equipment capacity and rising costs, the labor market has grown increasingly tight since the beginning of the pandemic, as shown in the chart below. According to the U.S. Bureau of Labor Statistics, oil and gas employment is still 10% below where it was before the pandemic. Attracting oil and gas workers back towards the shale patch has proven difficult, given the current unemployment rate below 4% and the wariness of some potential employees due to the multiple boom-and-bust cycles experienced in the last decade.

Increase in Drilled but Uncompleted Wells (DUCs) Bodes Well for 2023 Output
These risks provide significant headwinds to a U.S. production response in 2022. In an unconstrained market, a U.S. production response can take roughly six months to materialize. With current fundamentals at play, the prevailing $90+/bbl oil and $4+/MMBtu is likely to take much longer to make an impact. This is becoming evident in shale patch activity metrics. The chart below compares the total amount of operating horizontal drilling rigs (which drill into the shale rock to extract oil and natural gas) to the total amount of active frac crews (which stimulate the reservoir surrounding the drilled wellbore to produce oil and natural gas).
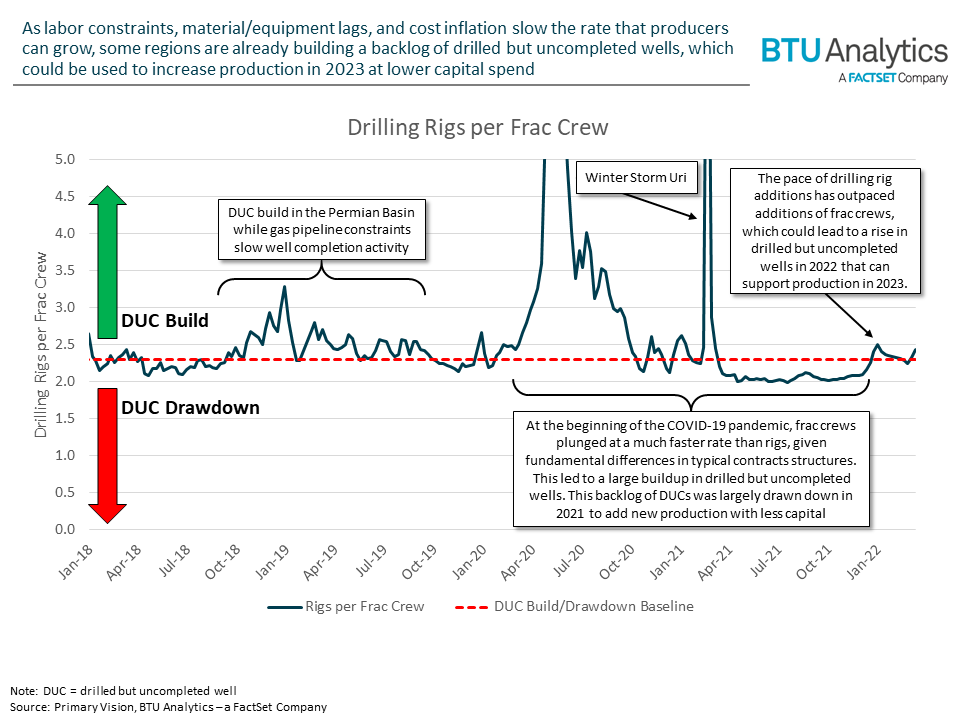
When the number of drilling rigs far outpaces the number of frac crews (generally by a rate of 2.3 rigs per frac crew), producers will usually build a backlog of drilled but uncompleted wells (DUCs). When frac crew additions outpace drilling rigs, that balance of DUCs is drawn down.
After a period of DUC drawdown in 2021, oil and gas producers have been rapidly adding drilling rigs while additional frac crews have lagged. While this limits the ability of producers to grow production this year, this DUC build could provide a better opportunity to grow in years to come. This is because producers are using the current cash windfall to invest in drilling new wells. Drilling generally represents one third of a well’s total capital cost, meaning that a third of a well’s capital is sunk in 2022 and drives 2023 capex lower to achieve the same level of production.
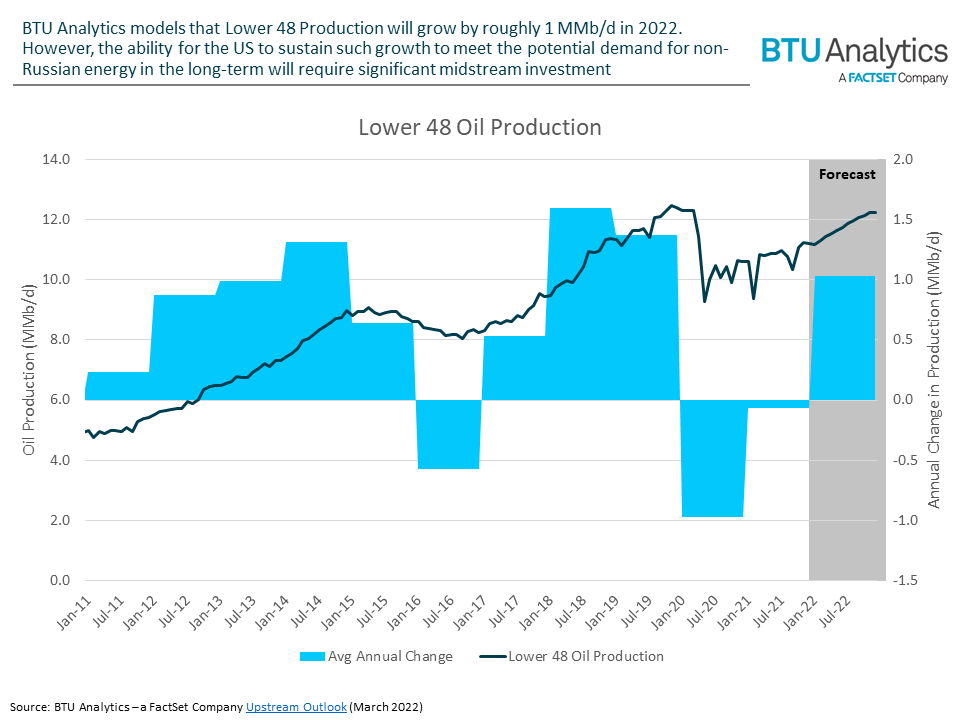
The chart below includes BTU Analytics’ forecast for 2022 oil production growth in the lower 48 states. In total, oil production is modeled to grow by more than 1 MMb/d over average 2021 levels and approach 2019 peaks by the end of the year. However, replacing the significant reliance that some Western countries have on Russian oil will require much more than an additional 1 MMb/d from the U.S.
Infrastructure Bottlenecks Remain
To increase production and sustain it for years to come, the U.S. faces additional challenges. First and foremost are the impending infrastructure bottlenecks facing several major producing regions. To receive financing, major infrastructure projects like pipelines require long-term commitments from producers. In addition, once these commitments and financing are secured, projects take time to come to market, further exacerbated by the tightness in labor and steel markets.
This is not unique to oil production. Natural gas production faces similar headwinds, as higher demand for U.S. liquefied natural gas (LNG) would require more LNG export terminals to be built, given that the U.S. is already producing near its LNG capacity. Those projects take years to receive approval, obtain financing, and ultimately be built. On top of that, the facilities require pipelines to connect them to natural gas production.
Conclusion
While the U.S. can supply the global market with significant energy, doing so will require clear communication from both governments and investors alike that this growth is necessary in the long run. However, existing environmental goals may make this difficult, as significant investment is already being poured into alternative energy sources and away from fossil fuels.
BTU Analytics, a FactSet Company, offers market reports, bespoke consulting, and energy analysis tools that enable timely investment decisions. BTU Analytics publishes a five-year outlook for the North American oil and gas sector each month in the Upstream Outlook. Additionally, join us on April 6 for our webinar “Is the Era of Cheap US Energy Over?”