Last week, BTU Analytics examined the expected effects of offshore wind buildout on natural gas-fired power plants in New England. While offshore wind projects have been in the spotlight, another quieter trend is playing out across the region and has been accelerating over the last several years, and that is small-scale solar development. Today’s Energy Market Insight will take a closer look at how this growing resource may also impact gas-fired generation.
New England isn’t exactly known for its blistering summers or ample sunshine. In fact, average solar irradiance across the ISO New England (ISO-NE) footprint is more comparable to that of the northern reaches of Minnesota or North Dakota than the sun-drenched acreage of Southern California, Arizona, New Mexico, and West Texas. This lack of solar resource is reflected by the degree of interest, or lack thereof, by utility-scale solar developers in the region. To date, not a single operational solar project in ISO-NE exceeds 100 MW, and only six solar projects are in service that exceed 20 MW across the entire six-state region. Despite only middling interest by large-scale developers, a different kind of solar development has been quietly occurring.
Behind the meter (“BTM”) solar typically represents micro-scale projects, which are the kind of rooftop solar projects one would expect to see in their own backyard, on the roof of a neighborhood school, or on a local shopping center. As of December 2021, ISO-NE estimated that over 240,000 such projects were in existence across the ISO. While individually small, these resources have steadily grown in capacity in the aggregate and, in the summer months, now generate nearly 3 GW of power during the intraday solar peak.
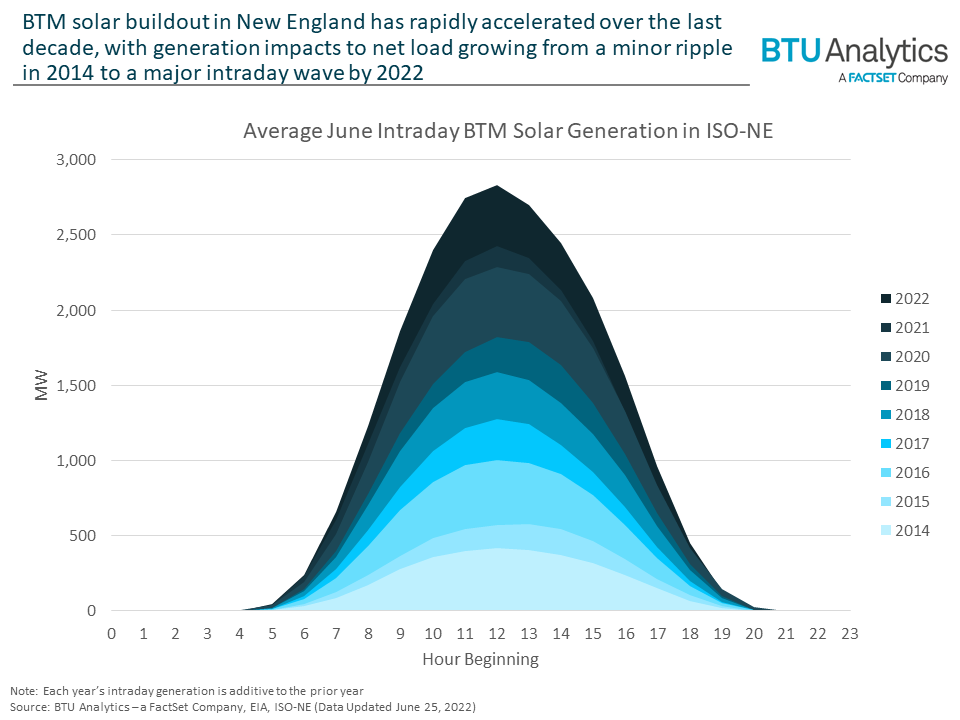
Notably, due to their small size and distributed nature, most BTM solar isn’t telemetered in real-time (hence the “behind the meter” designation). As a result, the way BTM solar affects the intraday load curve differs from most other resources connected to the grid. Instead of separately reporting BTM generation against system load, this generation is deducted from load as reported. Contributions by BTM solar are, therefore, hidden in typical supply and demand reporting by balancing authorities.
BTU Analytics has previously written about the emergence of the duck curve in various US power markets; while not as extreme as some other markets in the US, such a curve has been hiding behind the meter in New England. By separating BTM generation from load, the readjusted load curve represents the actual load across the grid rather than net load met by metered generation sources.
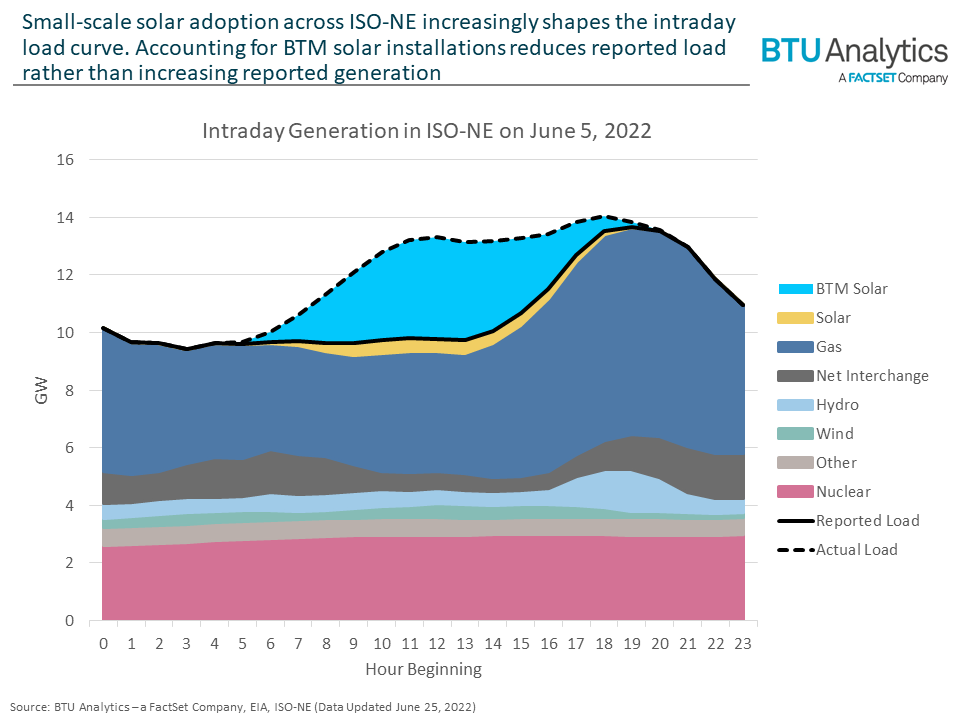
During the day in ISO-NE, solar generation appears to suppress both net imports and gas-fired generation. However, the rapid surge of solar power onto the grid during a bright, sunny day dissipates as quickly as it arrives, which is typically right as grid conditions are tightening. When solar generation falls off in the evening, dispatchable generation (like gas) must rapidly ramp up as load reaches its daily peak. As solar buildout continues, this effect is expected to become more significant, meaning either a larger or a faster ramp up in dispatchable generation will be required, or both. Natural gas-fired power plants capable of quickly answering the call in either of these dimensions may be more likely to sustain their economic viability.
Expanding beyond BTM solar for a moment to include utility-scale solar, ISO-NE forecasts the deployment of all solar resources within their control area. Assuming these solar forecasts play out as expected, how might this additional capacity buildout contribute to the displacement of natural gas-fired generation in the future? Let’s revisit a version of the gas displacement scenario chart from last week to layer on these potential effects.
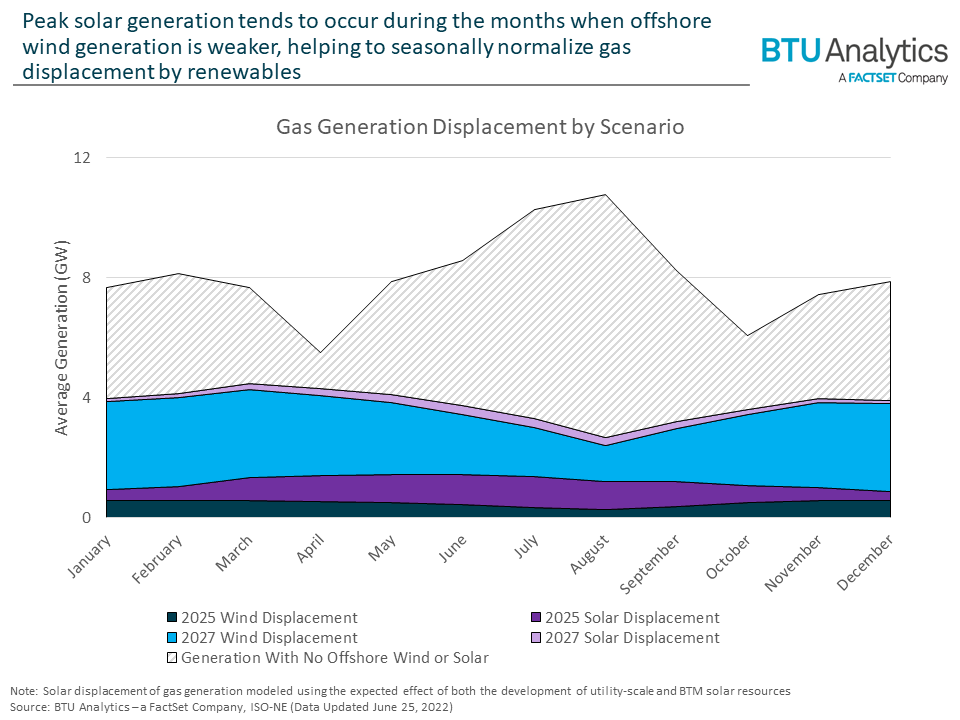
As observed in BTU Analytics’ previous look at offshore wind, average capacity factors for renewables often vary seasonally. Wind generation tends to peak during the early spring then fall off into the late summer, and solar reaches its highest output in the bright summer months before output markedly declines at the onset of winter. As renewable generation serves a larger share of load, there are simply fewer megawatt-hours needed by grid operators to close the supply/demand gap, which results in a lower call on dispatchable generation. The complementary dynamics between wind and solar buildout could further pressure gas-fired plants that were counting on strong seasonal sales to bolster their economic viability.
Power generation and load dynamics continue to evolve in concert with local and regional factors. The emergence of a duck curve in ISO-NE is one unexpected consequence of an often-overlooked source of generation in New England that, like offshore wind, will have significant effects on existing thermal power plants across the region.