Previously we have discussed how BTU Analytics’ Power View helps you to cut through the noise in generation queues and get a clear picture of new capacity coming to market, as well as how you can access natural gas plant data on specific pipeline footprints. Now you can seamlessly sort through, filter, and download hourly, unit-level heat input and generation data from the EPA’s Continuous Emissions Monitoring System (CEMS) dataset through BTU’s Power View, allowing for quick access to granular data in just a few clicks.
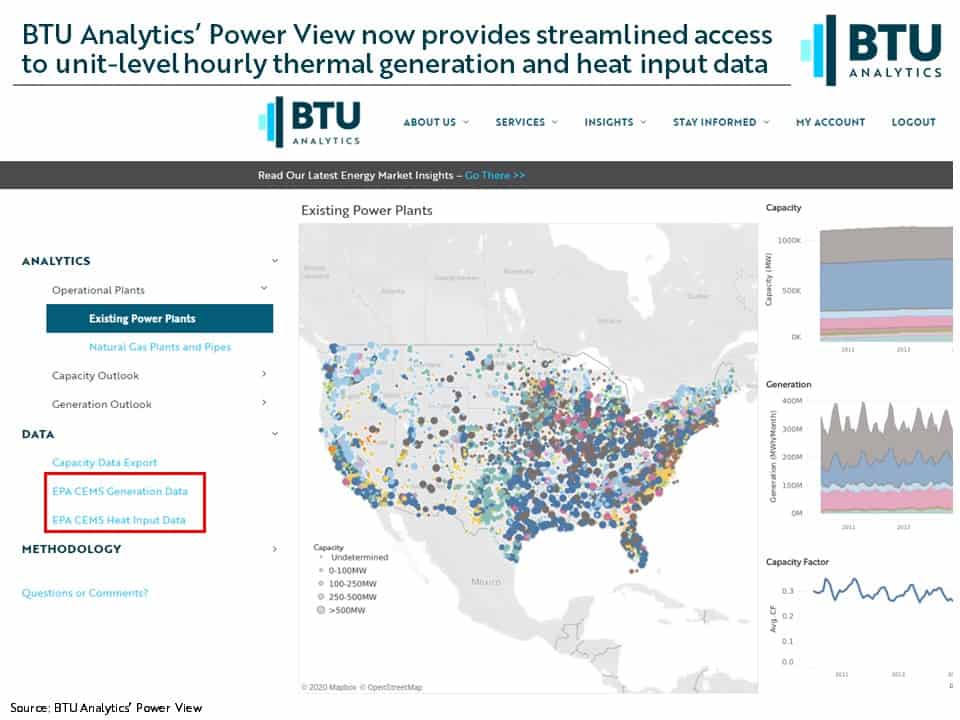
Hourly, unit-level data allows you to see the impacts on thermal plants throughout the day of renewables generation or waning demand, as well as to evaluate the required size of transportation contracts needed to serve that plant.
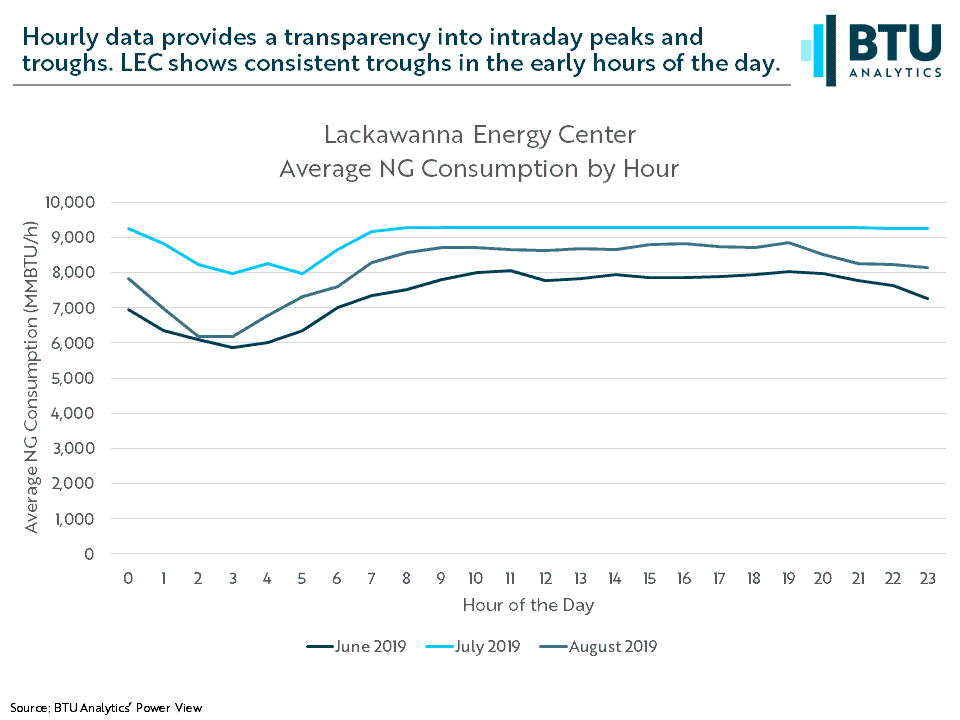
Using data from the Power View, we’ll use heat input (in this case, natural gas consumption) at the 1.5 GW Lackawanna Energy Center (LEC) in Pennsylvania as an example. Let’s first look at the data to see fluctuations in consumption throughout the day. The following graphic shows that even during times of peak seasonal demand, troughs in consumption still appear in the early morning hours as intra-day load wanes.
Beyond intra-day dynamics, we can also look at distributions of gas consumption throughout the year. BTU provides access and the ability to download data back through 2015, so you can see trends in consumption through time and evaluate the efficacy of firm transport contracts and the exposure to potential pipeline overage or imbalance charges. In this case, we pulled data from 2019 for the LEC so we could see the distributions of hourly consumption each month throughout the year. The boxes represent quartile ranges of hourly consumption for that month, while the dot is the median, and the lines represent the minimum and maximum hourly consumption.
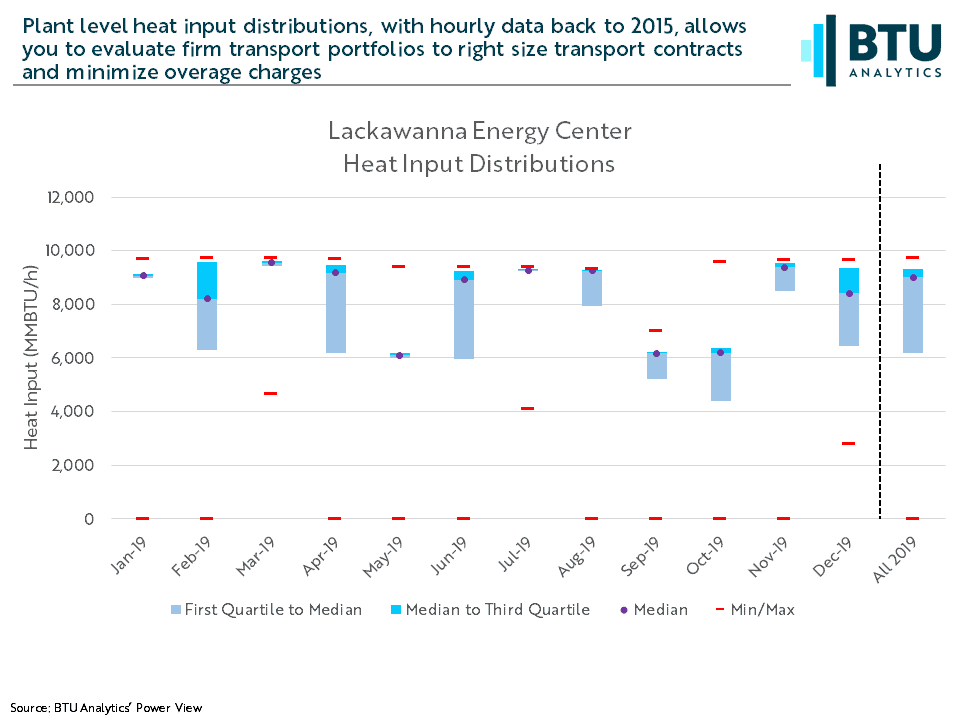
Although there is some variation in consumption at the LEC, 75% of all the hours in 2019 saw deliveries of over 6,000 MMBTU with the median hourly consumption sitting at 9,000 MMBTU, pretty close to the plant’s annual max of 9,700 MMBTU. This data could then be used to determine when a plant may be paying overage charges, and thereby impacting the plant’s supply costs, by comparing daily or hourly consumption to firm transport agreements.
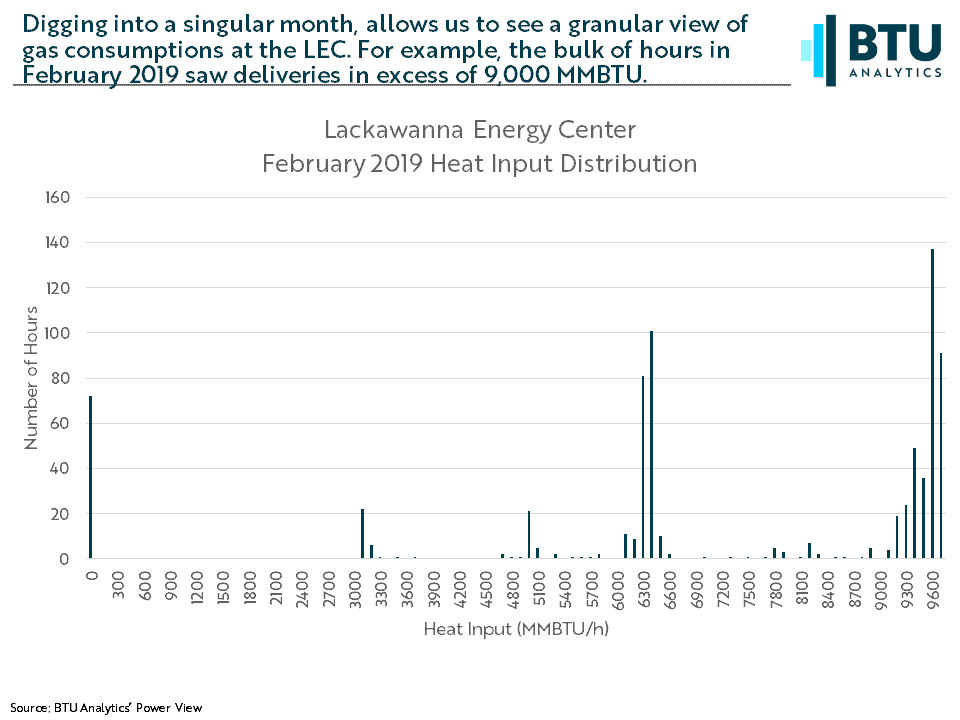
We can take this a level deeper and look at the distribution through a single month. The following graphic shows the distribution of deliveries in February 2019 at the LEC, with the bulk of hourly deliveries in that month in excess of 9,000 MMBTU.
While the graphics above have just focused on gas consumption at a single plant, we could easily repeat this analysis for load instead of heat input and on a portfolio of plants instead of a singular plant. If you would like to discuss how this data could be used in decision making and investment decisions, or if you would like to see the other features in BTU’s Power View, setup your one-on-one demo today.